
../
about/
projects/met-data/
repository/
support/
contact/
Microclimatic Variability on Mount Olympus: A Systematic Record of Meteorological Observations
Topography
1.1: Local environment
1.2: Climate
1.3: Maps
Stevenson screen
2.1: Instrument shelter
2.2: Specifications
Data
3.1: Air Temperature statistics
3.2: Relative Humidity statistics
3.3: Precipitation statistics
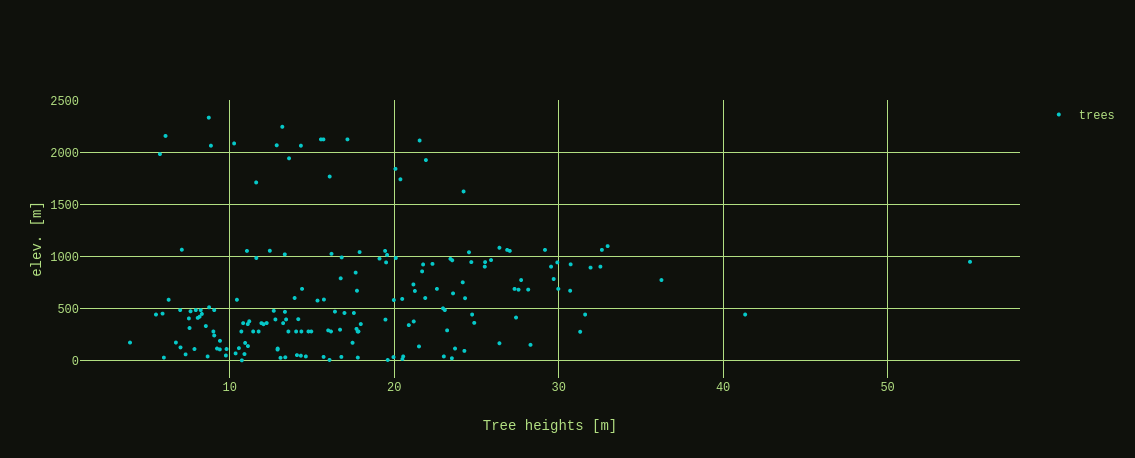
3.4: Tree heights
3.5: Sunshine duration
3.6: Solar Noon
3.7: Citations
—————————————————————
Topography and the local environment:
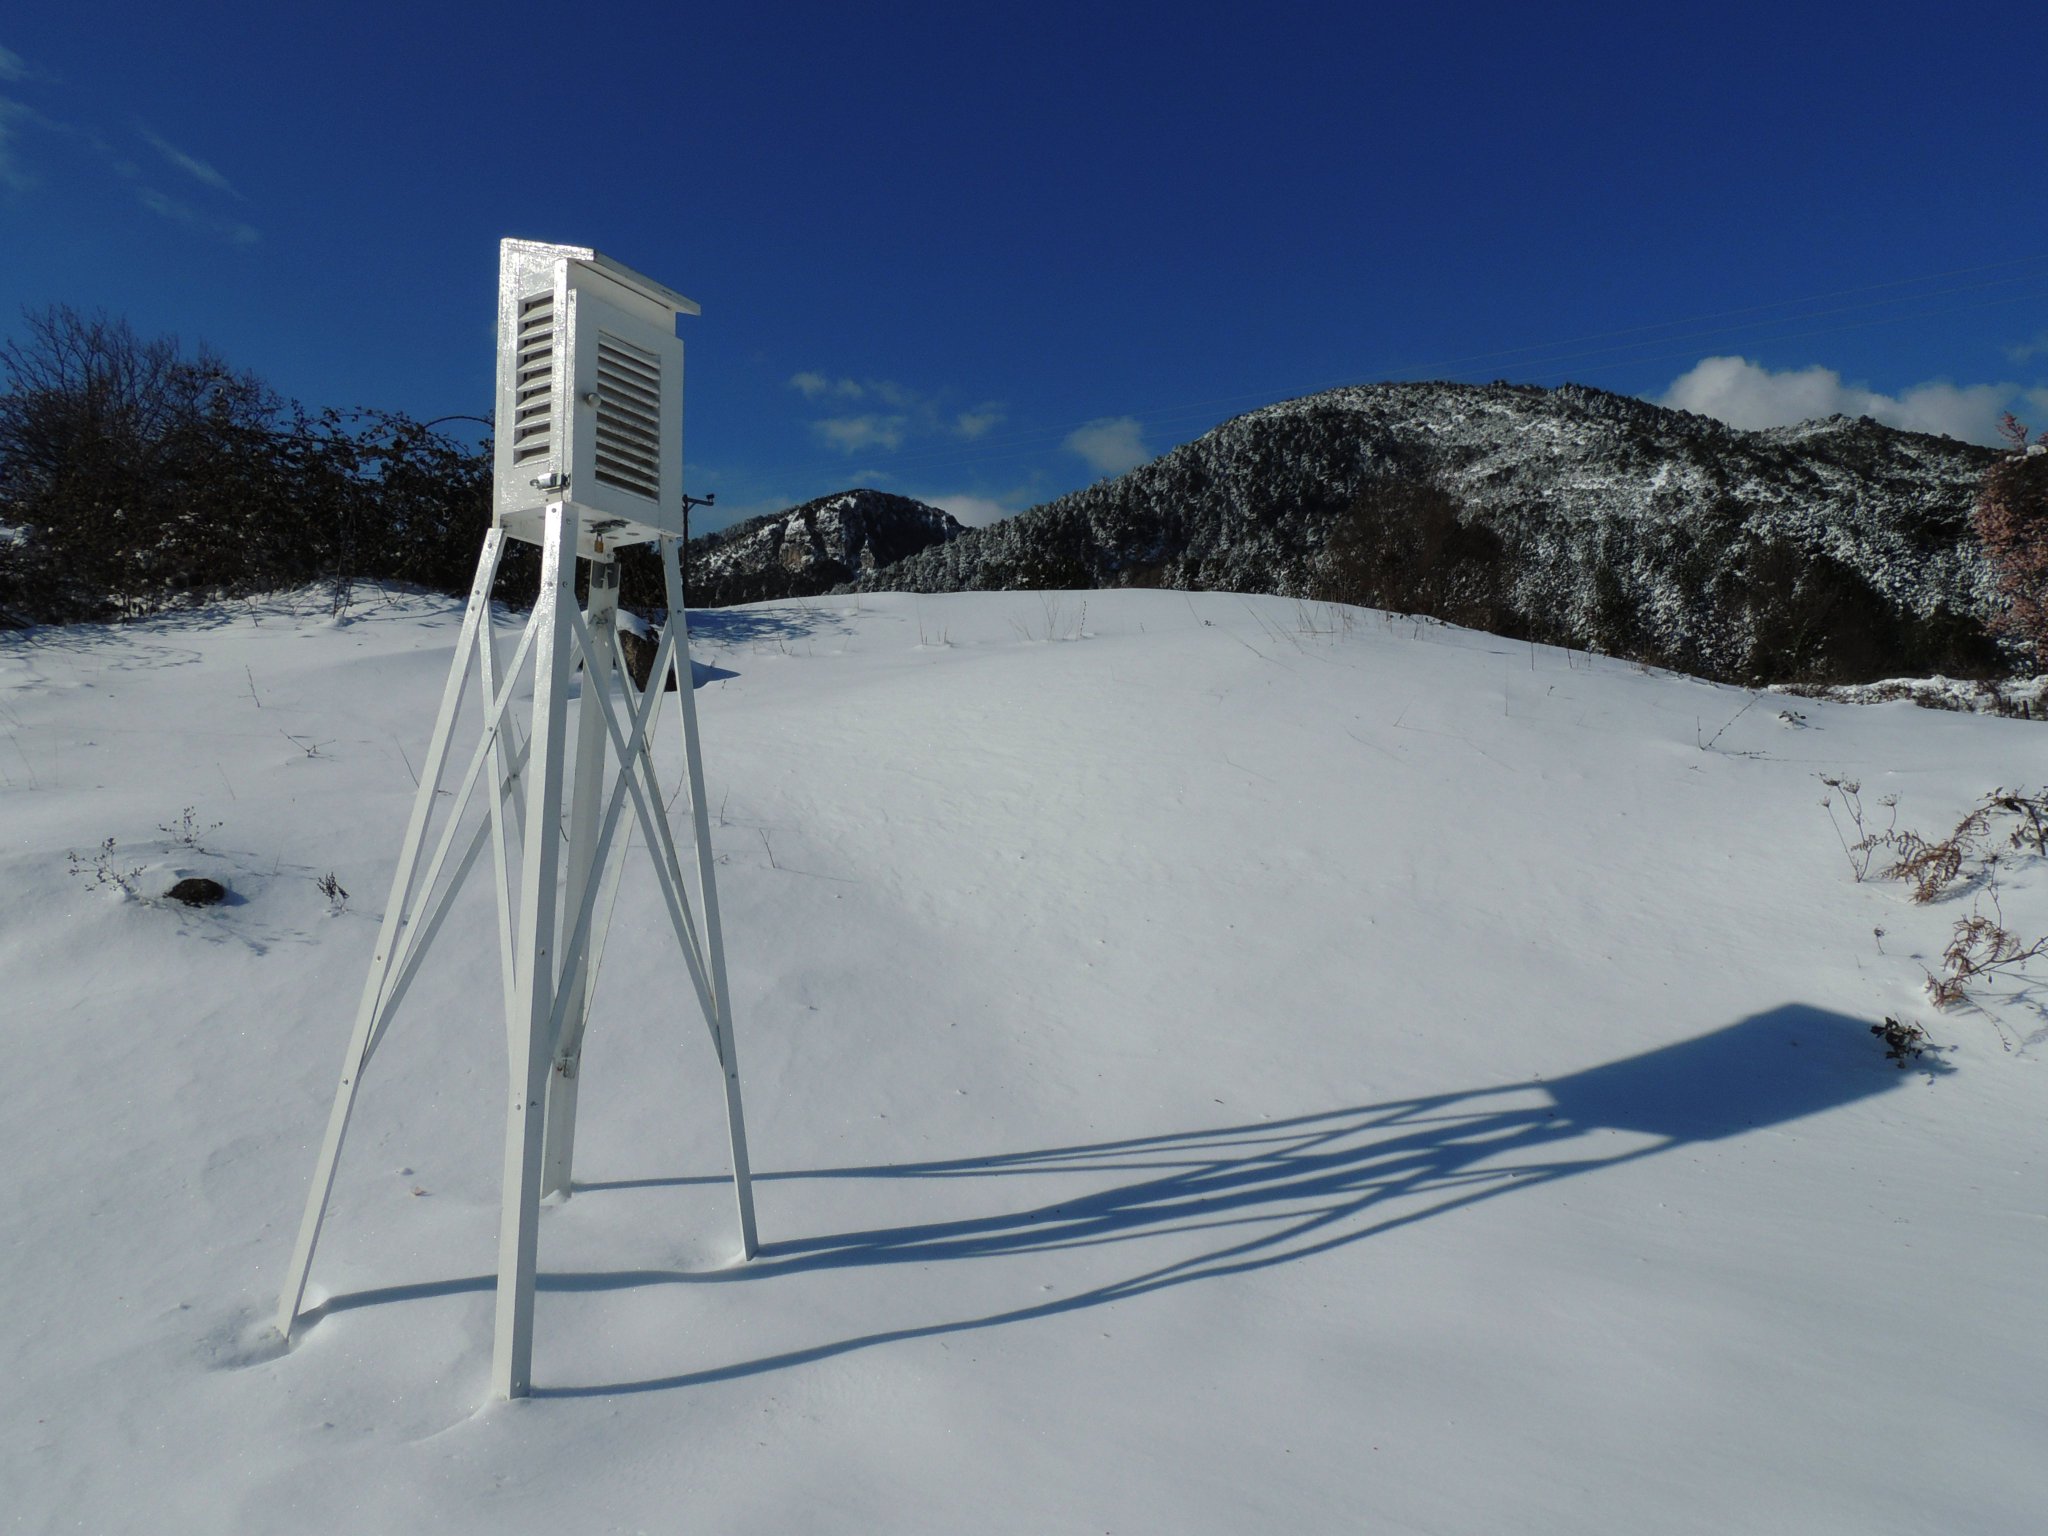
Laboratory is located on the eastern slopes of mt.Olympus, in the heart of broad-leaved evergreens [Quercetalia ilicis] at an altitude of 400m. The area is dominated by shrubs and low-rising trees such as the holm oak [Quercus ilex], Greek strawberry tree [Arbutus adrachnae], kermes oak [Quercus coccifera], strawberry tree [Arbutus unedo], prickly Juniper [Juniperus oxycedrus], etc. Characteristic deciduous species at this altitude include manna ash [Fraxinus ornus], Montpellier maple [Acer monspessulanum], Judas-tree [Cercis siliquastrum], European smoke tree [Cotinus coggygria] and others.
Climate can be described as one of Mediterranean type with continental influence, hot and dry in the summer, while humid and cold in the winter. Its local variations are the result of the impact of the sea and the rugged relief of the region. Based on the Köppen-Geiger climate classification, this area typically falls under [Csa] category.
Maps:
Map.1 ΓΥΣ [HMGS/ArcGIS] 1:18.000
Map.2 ΓΥΣ [HMGS/ArcGIS] 1:9.000
Map.3 ΓΥΣ [HMGS/ArcGIS] 1:4.500
Map.4 Советская Армия [SA/1971-1991] 1:50.000
Map.5 Советская Армия [SA/1971-1991] 1:50.000
ISS Crew Earth Observations experiment ISS010-E-8224 [Kodak 760C 50mm lens – 22.11.2004]
Laboratory’s instrument shelter holds meteorological equipment that can be measure the atmosphere’s Temperature [Current/Max/Min-°C], Barometric Pressure [hPa], Relative Humidity [%], Precipitation [Rain/Snow-mm], Clouds [High/Mid/Low Level Identification/Photos], Aerosol Optical Thickness [AOT], Surface/Soil Temperature [5/10cm °C] and Surface Conditions.
| Station Index ID | 193799 | GLOBE Site | Research Area: LIT-193799S3 |
| Latitude | 40.096737° |
| Longitude | 22.497476° |
| Grid Square | KN10fc |
| Elevation | 400m |
| Field code | MUC 93 |
| Established | 09.04.2020 |
| Status | Operational |
| Type | Conventional |
| Observations | Data [Online] |
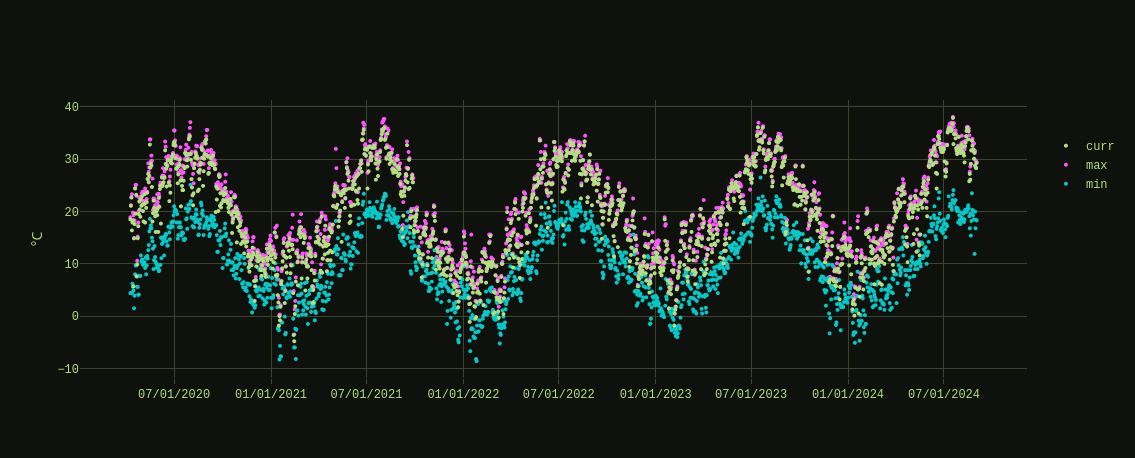
Air temperature statistics [°C]:
Recording daily measurements of temperature at LSN, is vital for understanding local climate patterns and contributing to broader climate science. These temperature data points provide insights into daily thermal variations, heat distribution, and energy balance within a given area. They are essential for detecting trends related to climate change, such as shifts in seasonal patterns and the frequency of extreme weather events. In addition, accurate local temperature measurements support agricultural planning, public health initiatives, and the management of natural resources.
| Annual Air Temp | |||||
|---|---|---|---|---|---|
| Year | Average Mean* | Average High | Average Low | Record High** | Record Low |
| 2020*** | N/A | N/A | N/A | 37.1 | N/A |
| 2021 | 17.7 | 19.5 | 9.4 | 37.7 | -8.3 |
| 2022 | 17.9 | 19.5 | 9.5 | 33.9 | -8.6 |
| 2023 | 18.5 | 20.1 | 9.8 | 37.0 | -4.0 |
| 2024 | 19.2 | 21.0 | 9.9 | 38.1 | -5.1 |
| 2025 | 18.6 | 20.4 | 9.8 | 38.3 | -3.0 |
| 2026 | N/A | N/A | N/A | N/A | N/A |
| Seasonal Air Temp | |||||
| Spring [01 Mar-31 May] | |||||
| Year | Average Mean* | Average High | Average Low | Record High** | Record Low |
| 2020*** | N/A | N/A | N/A | 33.8 | N/A |
| 2021 | 15.8 | 17.8 | 6.8 | 32.0 | -1.5 |
| 2022 | 15.5 | 17.4 | 6.9 | 33.9 | -5.2 |
| 2023 | 15.3 | 17.2 | 7.2 | 26.0 | 0.5 |
| 2024 | 17.9 | 19.6 | 8.2 | 26.7 | 1.2 |
| 2025 | 16.7 | 18.4 | 7.4 | 26.2 | -1.6 |
| 2026 | N/A | N/A | N/A | N/A | N/A |
| Summer [01 Jun-31 Aug] | |||||
| Year | Average Mean* | Average High | Average Low | Record High** | Record Low |
| 2020*** | 24.7 | 29.8 | 16.9 | 37.1 | 8.6 |
| 2021 | 29.5 | 30.7 | 18.5 | 37.7 | 9.1 |
| 2022 | 28.4 | 29.8 | 18.0 | 33.6 | 14.0 |
| 2023 | 28.8 | 30.1 | 18.1 | 37.0 | 11.2 |
| 2024 | 31.1 | 33.0 | 18.4 | 38.1 | 11.9 |
| 2025 | 30.9 | 32.5 | 18.6 | 38.3 | 12.6 |
| 2026 | N/A | N/A | N/A | N/A | N/A |
| Autumn [01 Sep-30 Nov] | |||||
| Year | Average Mean* | Average High | Average Low | Record High** | Record Low |
| 2020*** | 20.2 | 21.6 | 11.1 | 35.6 | 0.7 |
| 2021 | 16.9 | 18.5 | 10.2 | 33.4 | 2.7 |
| 2022 | 19.5 | 20.8 | 10.9 | 29.0 | 2.0 |
| 2023 | 20.0 | 21.6 | 11.7 | 30.6 | -3.3 |
| 2024 | 18.3 | 20.1 | 9.9 | 31.9 | -2.7 |
| 2025 | 19.0 | 21.1 | 10.9 | 33.0 | 2.3 |
| 2026 | N/A | N/A | N/A | N/A | N/A |
| Winter [01 Dec-28 Feb] | |||||
| Year | Average Mean* | Average High | Average Low | Record High** | Record Low |
| 2020*** | 9.4 | 11.3 | 3.1 | 19.5 | -8.3 |
| 2021 | 7.7 | 9.5 | 1.2 | 16.2 | -8.6 |
| 2022 | 9.6 | 11.1 | 2.8 | 18.9 | -4.0 |
| 2023 | 10.4 | 12.4 | 3.1 | 20.6 | -5.1 |
| 2024 | 6.9 | 8.6 | 1.8 | 16.8 | -3.0 |
| 2025 | 9.6 | 11.7 | 3.4 | 18.1 | -7.7 |
| 2026 | N/A | N/A | N/A | N/A | N/A |
| Monthly Air Temp | |||||
| Month/Year | Average Mean* | Average High | Average Low | Record High | Record Low |
| 04/2020 | 17.9 | 20.5 | 6.3 | 25.1 | 1.5 |
| 05/2020 | 22.5 | 24.6 | 11.9 | 33.8 | 8.0 |
| 06/2020 | 23.2 | 28.0 | 14.4 | 33.4 | 8.6 |
| 07/2020 | 22.5 | 30.8 | 17.9 | 36.0 | 14.6 |
| 08/2020 | 28.5 | 30.7 | 18.5 | 37.1 | 15.5 |
| 09/2020 | 26.5 | 27.8 | 15.9 | 35.6 | 12.3 |
| 10/2020 | 20.9 | 22.2 | 11.3 | 27.1 | 7.2 |
| 11/2020 | 13.1 | 14.9 | 6.2 | 19.6 | 0.7 |
| 12/2020 | 9.9 | 11.0 | 5.3 | 15.4 | 1.6 |
| 01/2021 | 8.2 | 10.5 | 1.7 | 17.3 | -8.3 |
| 02/2021 | 10.0 | 12.4 | 2.4 | 19.5 | -8.2 |
| 03/2021 | 10.7 | 12.5 | 2.7 | 18.1 | -1.5 |
| 04/2021 | 14.0 | 16.0 | 5.8 | 23.2 | 1.2 |
| 05/2021 | 22.6 | 24.9 | 12.0 | 32.0 | 7.8 |
| 06/2021 | 27.0 | 28.4 | 15.7 | 37.0 | 9.1 |
| 07/2021 | 30.8 | 31.7 | 19.9 | 37.0 | 17.0 |
| 08/2021 | 30.6 | 32.1 | 19.8 | 37.7 | 17.1 |
| 09/2021 | 23.5 | 25.5 | 15.0 | 33.4 | 8.1 |
| 10/2021 | 14.4 | 15.9 | 8.7 | 20.8 | 4.8 |
| 11/2021 | 12.7 | 14.2 | 7.0 | 21.2 | 2.7 |
| 12/2021 | 8.0 | 9.4 | 2.1 | 14.1 | 2.8 |
| 01/2022 | 6.3 | 8.3 | 0.0 | 16.2 | -8.6 |
| 02/2022 | 8.8 | 10.7 | 1.5 | 15.6 | -2.1 |
| 03/2022 | 7.9 | 9.5 | 1.2 | 20.7 | -5.2 |
| 04/2022 | 15.9 | 18.0 | 7.5 | 23.7 | 2.9 |
| 05/2022 | 22.7 | 24.6 | 12.0 | 33.9 | 7.1 |
| 06/2022 | 27.4 | 28.8 | 17.0 | 33.3 | 14.0 |
| 07/2022 | 29.3 | 30.7 | 18.5 | 33.6 | 13.7 |
| 08/2022 | 28.6 | 30.0 | 18.6 | 34.5 | 14.2 |
| 09/2022 | 23.5 | 24.8 | 14.2 | 29.0 | 7.3 |
| 10/2022 | 20.1 | 21.2 | 10.4 | 26.4 | 6.4 |
| 11/2022 | 14.9 | 16.5 | 8.1 | 24.3 | 2.0 |
| 12/2022 | 9.7 | 11.0 | 4.8 | 18.7 | -1.5 |
| 01/2023 | 9.5 | 11.3 | 2.3 | 18.9 | -2.7 |
| 02/2023 | 9.6 | 11.0 | 1.2 | 18.0 | -4.0 |
| 03/2023 | 12.7 | 14.6 | 4.4 | 20.5 | 0.5 |
| 04/2023 | 14.2 | 16.2 | 6.4 | 22.2 | 0.7 |
| 05/2023 | 19.1 | 20.7 | 10.9 | 26.0 | 7.4 |
| 06/2023 | 24.8 | 26.2 | 15.2 | 30.6 | 11.2 |
| 07/2023 | 31.2 | 32.3 | 19.7 | 37.0 | 15.4 |
| 08/2023 | 30.5 | 31.7 | 19.4 | 34.9 | 15.0 |
| 09/2023 | 24.3 | 25.7 | 15.7 | 30.6 | 12.7 |
| 10/2023 | 21.0 | 22.5 | 12.0 | 28.8 | 7.1 |
| 11/2023 | 14.6 | 16.6 | 7.4 | 23.5 | -3.3 |
| 12/2023 | 10.7 | 12.6 | 3.3 | 19.2 | -2.7 |
| 01/2024 | 7.8 | 10.1 | 1.5 | 19.1 | -5.1 |
| 02/2024 | 12.7 | 14.4 | 4.6 | 20.6 | -3.2 |
| 03/2024 | 13.5 | 15.2 | 4.6 | 21.8 | 1.2 |
| 04/2024 | 20.2 | 21.6 | 9.0 | 26.2 | 2.5 |
| 05/2024 | 20.0 | 22.1 | 11.1 | 26.7 | 7.6 |
| 06/2024 | 30.6 | 31.9 | 17.4 | 35.3 | 12.3 |
| 07/2024 | 31.2 | 34.1 | 18.9 | 38.1 | 15.1 |
| 08/2024 | 31.5 | 32.8 | 19.0 | 36.2 | 11.9 |
| 09/2024 | 24.4 | 26.2 | 14.7 | 31.9 | 10.5 |
| 10/2024 | 19.9 | 21.4 | 10.3 | 25.8 | 5.9 |
| 11/2024 | 10.7 | 12.6 | 4.6 | 19.3 | -2.7 |
| 12/2024 | 7.7 | 9.5 | 2.5 | 15.2 | -2.0 |
| 01/2025 | 7.7 | 9.3 | 1.8 | 16.8 | -1.4 |
| 02/2025 | 5.3 | 6.9 | 1.1 | 15.4 | -3.0 |
| 03/2025 | 13.3 | 14.7 | 4.6 | 22.1 | -1.6 |
| 04/2025 | 15.9 | 17.8 | 6.7 | 23.8 | -0.9 |
| 05/2025 | 20.9 | 22.8 | 11.1 | 26.2 | 5.1 |
| 06/2025 | 30.8 | 31.5 | 18.0 | 36.5 | 12.6 |
| 07/2025 | 32.6 | 34.5 | 19.8 | 38.3 | 12.8 |
| 08/2025 | 29.4 | 31.4 | 18.0 | 35.5 | 14.5 |
| 09/2025 | 25.9 | 28.2 | 15.5 | 33.0 | 11.5 |
| 10/2025 | 16.5 | 18.5 | 9.4 | 24.0 | 4.3 |
| 11/2025 | 14.7 | 16.5 | 7.8 | 19.6 | 2.3 |
| 12/2025 | 10.0 | 12.1 | 3.9 | 14.3 | -2.4 |
| 01/2026 | 7.6 | 9.7 | 2.0 | 18.1 | -7.7 |
| 02/2026 | 11.1 | 13.3 | 4.2 | 17.9 | -0.4 |
| 03/2026 | 12.6 | 14.5 | 3.5 | 17.7 | 0.1 |
| 04/2026 | N/A | N/A | N/A | N/A | N/A |
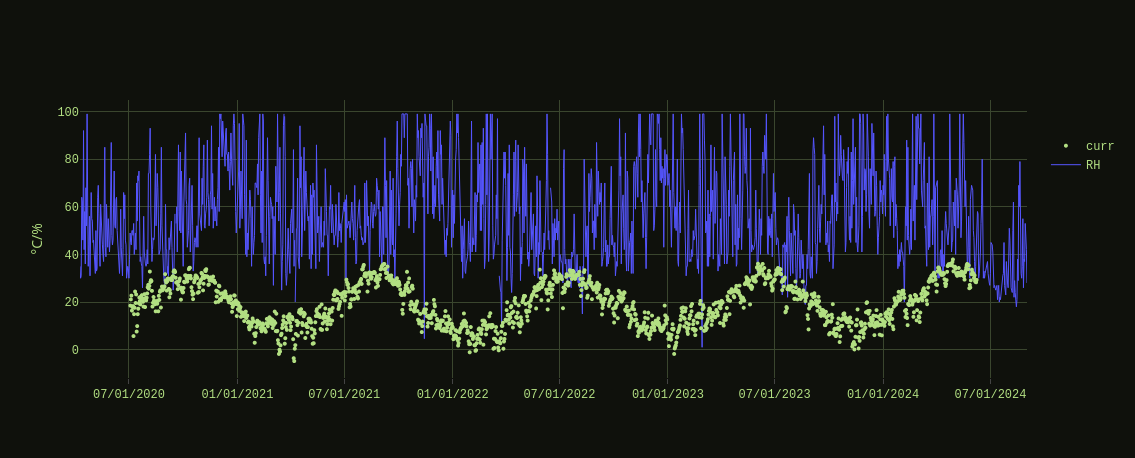
Relative humidity statistics [%]:
Measuring relative humidity is crucial for understanding the moisture content in the air, which has significant implications for weather patterns, climate studies, and local environmental conditions. Relative humidity influences evaporation rates, plant transpiration, and the comfort and health of living organisms, including humans. It plays a key role in determining dew point, cloud formation, and precipitation, making it an essential parameter for weather forecasting and climate modeling. By collecting and analyzing relative humidity data, we help to build a comprehensive picture of local and global atmospheric conditions, contributing to studies on climate variability, ecosystem health, and the impact of humidity on agriculture and natural habitats. This data is invaluable for informing environmental management practices and enhancing our understanding of how humidity interacts with other climatic factors.
| Annual RH | |||
|---|---|---|---|
| Year | Average Mean* | Record High | Record Low |
| 2020*** | 55.2 | 99 | 24 |
| 2021 | 61.0 | 99 | 20 |
| 2022 | 56.1 | 99 | 10 |
| 2023 | 57.5 | 99 | 19 |
| 2024 | 55.7 | 99 | 18 |
| 2025 | 61.4 | 99 | 16 |
| 2026 | N/A | N/A | N/A |
| Seasonal RH | |||
| Spring [01 Mar-31 May] | |||
| Year | Average Mean* | Record High** | Recoord Low |
| 2020*** | N/A | N/A | N/A |
| 2021 | 55.3 | 99 | 20 |
| 2022 | 54.7 | 99 | 10 |
| 2023 | 60.7 | 99 | 32 |
| 2024 | 58.9 | 99 | 30 |
| 2025 | 58.0 | 99 | 21 |
| 2026 | N/A | N/A | N/A |
| Summer [01 Jun-31 Aug] | |||
| Year | Average Mean* | Record High** | Record Low |
| 2020*** | 49.6 | 93 | 26 |
| 2021 | 53.9 | 75 | 29 |
| 2022 | 46.1 | 99 | 15 |
| 2023 | 46.6 | 99 | 19 |
| 2024 | 36.0 | 80 | 18 |
| 2025 | 38.7 | 84 | 16 |
| 2026 | N/A | N/A | N/A |
| Autumn [01 Sep-30 Nov] | |||
| Year | Average Mean* | Record High** | Record Low |
| 2020*** | 56.0 | 94 | 25 |
| 2021 | 70.6 | 99 | 29 |
| 2022 | 57.4 | 99 | 31 |
| 2023 | 63.2 | 99 | 30 |
| 2024 | 62.1 | 99 | 27 |
| 2025 | 70.3 | 99 | 29 |
| 2026 | N/A | N/A | N/A |
| Winter [01 Dec-28 Feb] | |||
| Year | Average Mean* | Record High** | Record Low |
| 2020*** | 69.1 | 99 | 31 |
| 2021 | 61.4 | 99 | 30 |
| 2022 | 63.5 | 99 | 31 |
| 2023 | 63.2 | 99 | 20 |
| 2024 | 78.4 | 99 | 40 |
| 2025 | 76.3 | 99 | 31 |
| 2026 | N/A | N/A | N/A |
| Monthly RH | |||
| Month/Year | Average Mean* | Record High | Record Low |
| 04/2020 | 51.6 | 99 | 24 |
| 05/2020 | 47.9 | 85 | 32 |
| 06/2020 | 48.4 | 87 | 30 |
| 07/2020 | 46.9 | 75 | 26 |
| 08/2020 | 53.4 | 93 | 27 |
| 09/2020 | 50.5 | 86 | 25 |
| 10/2020 | 55.8 | 91 | 33 |
| 11/2020 | 61.7 | 94 | 51 |
| 12/2020 | 80.9 | 99 | 49 |
| 01/2021 | 61.3 | 99 | 35 |
| 02/2021 | 65.0 | 99 | 31 |
| 03/2021 | 55.2 | 99 | 25 |
| 04/2021 | 57.5 | 94 | 20 |
| 05/2021 | 53.3 | 86 | 34 |
| 06/2021 | 53.1 | 69 | 31 |
| 07/2021 | 53.3 | 69 | 29 |
| 08/2021 | 55.3 | 75 | 32 |
| 09/2021 | 55.5 | 96 | 29 |
| 10/2021 | 75.5 | 99 | 49 |
| 11/2021 | 80.8 | 99 | 46 |
| 12/2021 | 66.0 | 96 | 39 |
| 01/2022 | 56.8 | 99 | 30 |
| 02/2022 | 61.3 | 99 | 34 |
| 03/2022 | 57.6 | 99 | 10 |
| 04/2022 | 55.7 | 88 | 24 |
| 05/2022 | 50.7 | 85 | 30 |
| 06/2022 | 53.2 | 99 | 31 |
| 07/2022 | 39.0 | 84 | 26 |
| 08/2022 | 46.1 | 80 | 15 |
| 09/2022 | 52.6 | 87 | 35 |
| 10/2022 | 51.7 | 97 | 31 |
| 11/2022 | 68.0 | 99 | 32 |
| 12/2022 | 79.9 | 99 | 43 |
| 01/2023 | 64.8 | 99 | 35 |
| 02/2023 | 45.8 | 99 | 31 |
| 03/2023 | 60.8 | 99 | 33 |
| 04/2023 | 60.2 | 99 | 35 |
| 05/2023 | 61.0 | 99 | 32 |
| 06/2023 | 58.3 | 99 | 31 |
| 07/2023 | 42.7 | 66 | 22 |
| 08/2023 | 38.7 | 74 | 19 |
| 09/2023 | 58.1 | 94 | 30 |
| 10/2023 | 64.2 | 99 | 34 |
| 11/2023 | 67.4 | 99 | 41 |
| 12/2023 | 67.5 | 99 | 40 |
| 01/2024 | 63.3 | 99 | 34 |
| 02/2024 | 58.8 | 99 | 20 |
| 03/2024 | 65.5 | 99 | 30 |
| 04/2024 | 48.6 | 99 | 30 |
| 05/2024 | 62.6 | 99 | 30 |
| 06/2024 | 41.4 | 80 | 27 |
| 07/2024 | 27.5 | 45 | 20 |
| 08/2024 | 39.2 | 79 | 18 |
| 09/2024 | 58.0 | 99 | 28 |
| 10/2024 | 58.9 | 99 | 27 |
| 11/2024 | 69.4 | 99 | 33 |
| 12/2024 | 75.7 | 99 | 40 |
| 01/2025 | 79.6 | 99 | 45 |
| 02/2025 | 79.9 | 99 | 46 |
| 03/2025 | 63.6 | 99 | 25 |
| 04/2025 | 57.0 | 99 | 29 |
| 05/2025 | 53.4 | 99 | 21 |
| 06/2025 | 36.3 | 50 | 20 |
| 07/2025 | 34.5 | 67 | 19 |
| 08/2025 | 45.2 | 84 | 16 |
| 09/2025 | 53.8 | 95 | 29 |
| 10/2025 | 75.0 | 99 | 36 |
| 11/2025 | 82.0 | 99 | 58 |
| 12/2025 | 76.6 | 99 | 31 |
| 01/2026 | 75.7 | 99 | 31 |
| 02/2026 | 76.5 | 99 | 36 |
| 03/2026 | 62.6 | 99 | 40 |
| 04/2026 | N/A | N/A | N/A |
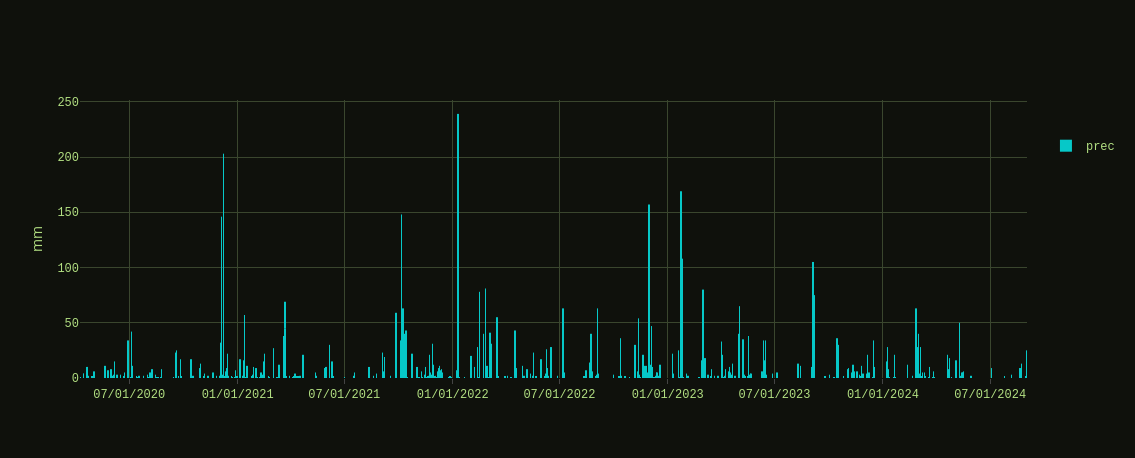
Precipitation statistics [mm]:
Recording precipitation is fundamental for understanding water cycles, weather patterns, and the availability of freshwater resources. Precipitation data provides critical information on rainfall, snow, sleet, and hail, all of which directly impact soil moisture, plant growth, and water supply for ecosystems and human use. By tracking precipitation, we can monitor drought conditions, flood risks, and long-term changes in regional and global climate patterns. These measurements also contribute to forecasting models and help in assessing the impact of climate change on local weather extremes.
| Annual Precipitation | |||
|---|---|---|---|
| Year | Average Mean* | Record High** | Totals |
| 2020*** | 2.9 | 203 | 776 |
| 2021 | 3.3 | 148 | 1192 |
| 2022 | 4.2 | 239 | 1551 |
| 2023 | 4.8 | 169 | 1763 |
| 2024 | 3.7 | 210 | 1345 |
| 2025 | 3.1 | 179 | 1125 |
| 2026 | N/A | N/A | N/A |
| Seasonal Precipitation | |||
| Spring [01 Mar-31 May] | |||
| Year | Average Mean* | Record High** | Totals |
| 2020*** | N/A | N/A | N/A |
| 2021 | 2.3 | 45 | 210 |
| 2022 | 2.5 | 55 | 162 |
| 2023 | 5.7 | 80 | 532 |
| 2024 | 2.6 | 80 | 242 |
| 2025 | 3.7 | 120 | 333 |
| 2026 | N/A | N/A | N/A |
| Summer [01 Jun-31 Aug] | |||
| Year | Average Mean* | Record High** | Totals |
| 2020*** | 1.8 | 42 | 168 |
| 2021 | 1.1 | 30 | 98 |
| 2022 | 3.0 | 63 | 271 |
| 2023 | 1.5 | 34 | 131 |
| 2024 | 0.7 | 25 | 63 |
| 2025 | 0.0 | 4 | 6 |
| 2026 | N/A | N/A | N/A |
| Autumn [01 Sep-30 Nov] | |||
| Year | Average Mean* | Record High** | Totals |
| 2020*** | 1.2 | 25 | 106 |
| 2021 | 7.3 | 148 | 674 |
| 2022 | 3.1 | 63 | 283 |
| 2023 | 4.6 | 105 | 416 |
| 2024 | 2.3 | 41 | 211 |
| 2025 | 2.7 | 61 | 250 |
| 2026 | N/A | N/A | N/A |
| Winter [01 Dec-28 Feb] | |||
| Year | Average Mean* | Record High** | Totals |
| 2020*** | 6.9 | 203 | 594 |
| 2021 | 7.1 | 239 | 635 |
| 2022 | 9.5 | 169 | 867 |
| 2023 | 3.0 | 63 | 266 |
| 2024 | 7.9 | 210 | 733 |
| 2025 | 8.7 | 179 | 783 |
| 2026 | N/A | N/A | N/A |
| Monthly Precipitation | |||
| Month/Year | Average Mean* | Record High** | Totals |
| 04/2020 | 1.2 | 10 | 27 |
| 05/2020 | 1.0 | 11 | 34 |
| 06/2020 | 2.5 | 34 | 76 |
| 07/2020 | 1.8 | 42 | 58 |
| 08/2020 | 1.0 | 8 | 34 |
| 09/2020 | 1.4 | 25 | 44 |
| 10/2020 | 1.4 | 17 | 41 |
| 11/2020 | 0.7 | 5 | 21 |
| 12/2020 | 14.2 | 203 | 441 |
| 01/2021 | 4.3 | 57 | 134 |
| 02/2021 | 0.6 | 9 | 19 |
| 03/2021 | 4.9 | 45 | 151 |
| 04/2021 | 1.4 | 21 | 42 |
| 05/2021 | 0.5 | 9 | 17 |
| 06/2021 | 2.3 | 30 | 69 |
| 07/2021 | 0.2 | 5 | 7 |
| 08/2021 | 0.7 | 10 | 22 |
| 09/2021 | 4.0 | 59 | 122 |
| 10/2021 | 14.4 | 148 | 447 |
| 11/2021 | 3.5 | 31 | 105 |
| 12/2021 | 1.8 | 11 | 57 |
| 01/2022 | 10.2 | 239 | 317 |
| 02/2022 | 9.3 | 81 | 261 |
| 03/2022 | 3.9 | 55 | 55 |
| 04/2022 | 2.2 | 43 | 66 |
| 05/2022 | 1.3 | 23 | 41 |
| 06/2022 | 3.0 | 28 | 89 |
| 07/2022 | 2.9 | 63 | 89 |
| 08/2022 | 3.0 | 40 | 93 |
| 09/2022 | 2.4 | 63 | 71 |
| 10/2022 | 1.4 | 36 | 44 |
| 11/2022 | 5.6 | 54 | 168 |
| 12/2022 | 8.3 | 157 | 257 |
| 01/2023 | 14.3 | 169 | 444 |
| 02/2023 | 5.9 | 80 | 166 |
| 03/2023 | 6.4 | 80 | 197 |
| 04/2023 | 3.4 | 33 | 106 |
| 05/2023 | 7.4 | 65 | 229 |
| 06/2023 | 3.4 | 34 | 102 |
| 07/2023 | 0.2 | 5 | 5 |
| 08/2023 | 0.8 | 13 | 24 |
| 09/2023 | 8.3 | 105 | 250 |
| 10/2023 | 3.2 | 36 | 99 |
| 11/2023 | 2.2 | 12 | 67 |
| 12/2023 | 2.4 | 34 | 74 |
| 01/2024 | 2.4 | 28 | 74 |
| 02/2024 | 4.1 | 63 | 118 |
| 03/2024 | 3.3 | 40 | 101 |
| 04/2024 | 1.6 | 21 | 49 |
| 05/2024 | 3.0 | 50 | 92 |
| 06/2024 | 0 | 0 | 0 |
| 07/2024 | 0.3 | 9 | 10 |
| 08/2024 | 1.7 | 25 | 53 |
| 09/2024 | 2.6 | 41 | 78 |
| 10/2024 | 0.8 | 14 | 24 |
| 11/2024 | 3.6 | 34 | 109 |
| 12/2024 | 20.5 | 210 | 637 |
| 01/2025 | 0.8 | 17 | 26 |
| 02/2025 | 2.5 | 21 | 70 |
| 03/2025 | 2.2 | 35 | 68 |
| 04/2025 | 6.8 | 120 | 203 |
| 05/2025 | 2.0 | 14 | 62 |
| 06/2025 | 0 | 0 | 0 |
| 07/2025 | 0 | 0 | 0 |
| 08/2025 | 0.1 | 4 | 6 |
| 09/2025 | 0.5 | 12 | 14 |
| 10/2025 | 5.1 | 61 | 160 |
| 11/2025 | 2.5 | 18 | 76 |
| 12/2025 | 14.2 | 179 | 440 |
| 01/2026 | 4.5 | 33 | 140 |
| 02/2026 | 7.3 | 94 | 203 |
| 03/2026 | 0.8 | 7 | 25 |
| 04/2026 | N/A | N/A | N/A |
Measuring tree height is a critical aspect and plays a significant role in understanding and monitoring local environments. Tree height serves as an essential indicator of ecosystem health, carbon sequestration potential, and biodiversity. By systematically measuring tree height, students and citizen scientists contribute valuable data that enhances our understanding of local and global carbon cycles, climate change impacts, and habitat conditions. Moreover, this data supports the development of sustainable forest management practices and policies, aiding in the preservation of natural resources and the maintenance of ecological balance. Engaging in such measurements fosters environmental stewardship and helps communities make informed decisions for a sustainable future.
Clarifications:
[1]: * Measurements have been taken +/-1h of Local Solar Noon. The methodology is based upon the Globe Program®/** Record High/24h/*** Data aggregation started in April 2020.
[2]: Usually, daily Atmosphere measurements uploaded within two-hours after Local Solar Noun.
[3]: Monthly summaries of daily data uploaded during the first week of the next month.
[4]: For Aerosol Optical Thickness [AOT] and Surface Temperature data you can go to Data [Online] at Instrument Shelter specifications and select the appropriate fields. For Tree Heights data visit GLOBE Science Data Visualization tool and select Biometry-Tree Heights protocol layer [Biosphere], choose site by School [Greece GLOBE v-School] and include ‘CS Sites’ at your search.
[5]: For more sites/protocols, visit citizen science project and select the ‘Research Area’ of your interest.
[6]: Find and use our data with GLOBE’s Advanced Data Access Tool. Users can refine searches using various parameters and then choose specific sites that contain the relevant measurements. For laboratory’s instrument shelter data, select the appropriate Protocols, the Date-Range and the following Site-Name [Research Area: LIT-193799S3].
Measuring sunshine duration is crucial for understanding the amount of solar energy that reaches a specific location, which influences various environmental and climatic processes. Sunshine duration affects temperature, evaporation rates, and plant photosynthesis, making it a key factor in agricultural productivity and ecosystem dynamics. By recording how long the sun shines each day, we can track seasonal variations, identify trends in sunlight exposure, and assess potential impacts on local weather patterns and climate change. Data on sunshine duration also contribute to studies on solar energy potential, helping to inform decisions on sustainable energy solutions.
| Month | ||||||
|---|---|---|---|---|---|---|
| Observed Data | Jan | Feb | Mar | Apr | May | Jun |
| Equation of Time [min] | -9.39 | -14.13 | -8.91 | 0.05 | 3.64 | -0.49 |
| Solar Declination | -21.08° | -12.61° | -2.06° | 9.84° | 18.91° | 23.32° |
| Az [Sunrise] | +117° | +105° | +92° | +76° | +64° | +57° |
| El [Sunrise] | 0° | 0° | 0° | 0° | 0° | 0° |
| Az [Sunset] | +227° | +240° | +250° | +267° | +280° | +289° |
| El [Sunset] | +13° | +13° | +18° | +18° | +17° | +13° |
| Apparent Sunrise [UTC] | 05:50 | 05:23 | 04:42 | 03:52 | 03:15 | 03:00 |
| Solar Noon [UTC] | 10:39 | 10:44 | 10:38 | 10:30 | 10:26 | 10:30 |
| Apparent Sunset [UTC] | 14:00 | 14:42 | 14:52 | 15:27 | 16:30 | 16:36 |
| Sunshine Hours* [H:M] | 08:10 | 09:19 | 10:10 | 11:35 | 13:15 | 13:36 |
| Solar Distance [AU] | 0.984 | 0.988 | 0.994 | 1.003 | 1.011 | 1.016 |
| Polar/Cartesian Charts | Data | Data | Data | Data | Data | Data |
| Jul | Aug | Sep | Oct | Nov | Dec | |
|---|---|---|---|---|---|---|
| Equation of Time [min] | -6.00 | -4.51 | 4.74 | 14.22 | 15.46 | 4.90 |
| Solar Declination | 21.49° | 13.98° | 2.95° | -8.58° | -18.53° | -23.27° |
| Az [Sunrise] | +60° | +70° | +85° | +100° | +113° | +120° |
| El [Sunrise] | 0° | 0° | 0° | 0° | 0° | 0° |
| Az [Sunset] | +286° | +276° | +256° | +241° | +228° | +225° |
| El [Sunset] | +13° | +13° | +20° | +17° | +15° | +11° |
| Apparent Sunrise [UTC] | 03:14 | 03:41 | 04:11 | 04:41 | 05:15 | 05:45 |
| Solar Noon [UTC] | 10:36 | 10:34 | 10:25 | 10:15 | 10:14 | 10:25 |
| Apparent Sunset [UTC] | 16:37 | 16:09 | 14:53 | 14:24 | 13:34 | 13:42 |
| Sunshine Hours* [H:M] | 13:23 | 12:28 | 10:42 | 09:43 | 08:19 | 07:57 |
| Solar Distance [AU] | 1.016 | 1.013 | 1.006 | 0.997 | 0.989 | 0.984 |
| Polar/Cartesian Charts | Data | Data | Data | Data | Data | Data |
Clarifications:
[1]: * Data calculated at 15th of each month on 2021/2022 in consideration the influence of the eastern-facing side of mt.Olympus at the following coordinates: 40°05’48.4″N 22°29’52.1″E.
[2]: Time Zone Offset: 28.03-30.10 UTC+3/31.10-27.03 UTC+2 Europe/Athens
[3]: Equation of Time and Solar Declination calculated at Local Solar Noon [LSN].
| Month | ||||||
|---|---|---|---|---|---|---|
| Day | Jan | Feb | Mar | Apr | May | Jun |
| 01 | 10:33 | 10:43 | 10:42 | 10:34 | 10:27 | 10:27 |
| 02 | 10:33 | 10:43 | 10:42 | 10:33 | 10:27 | 10:27 |
| 03 | 10:34 | 10:43 | 10:42 | 10:33 | 10:26 | 10:28 |
| 04 | 10:34 | 10:43 | 10:41 | 10:33 | 10:26 | 10:28 |
| 05 | 10:35 | 10:43 | 10:41 | 10:32 | 10:26 | 10:28 |
| 06 | 10:35 | 10:44 | 10:41 | 10:32 | 10:26 | 10:28 |
| 07 | 10:36 | 10:44 | 10:41 | 10:32 | 10:26 | 10:28 |
| 08 | 10:36 | 10:44 | 10:40 | 10:32 | 10:26 | 10:28 |
| 09 | 10:36 | 10:44 | 10:40 | 10:31 | 10:26 | 10:29 |
| 10 | 10:37 | 10:44 | 10:40 | 10:31 | 10:26 | 10:29 |
| 11 | 10:37 | 10:44 | 10:40 | 10:31 | 10:26 | 10:29 |
| 12 | 10:38 | 10:44 | 10:39 | 10:30 | 10:26 | 10:29 |
| 13 | 10:38 | 10:44 | 10:39 | 10:30 | 10:26 | 10:29 |
| 14 | 10:38 | 10:44 | 10:39 | 10:30 | 10:26 | 10:30 |
| 15 | 10:39 | 10:44 | 10:39 | 10:30 | 10:26 | 10:30 |
| 16 | 10:39 | 10:44 | 10:38 | 10:29 | 10:26 | 10:30 |
| 17 | 10:39 | 10:44 | 10:38 | 10:29 | 10:26 | 10:30 |
| 18 | 10:40 | 10:43 | 10:38 | 10:29 | 10:26 | 10:31 |
| 19 | 10:40 | 10:43 | 10:37 | 10:29 | 10:26 | 10:31 |
| 20 | 10:40 | 10:43 | 10:37* | 10:29 | 10:26 | 10:31 |
| 21 | 10:41 | 10:43 | 10:37 | 10:28 | 10:26 | 10:31** |
| 22 | 10:41 | 10:43 | 10:37 | 10:28 | 10:26 | 10:31 |
| 23 | 10:41 | 10:43 | 10:36 | 10:28 | 10:26 | 10:32 |
| 24 | 10:41 | 10:43 | 10:36 | 10:28 | 10:26 | 10:32 |
| 25 | 10:42 | 10:43 | 10:36 | 10:28 | 10:26 | 10:32 |
| 26 | 10:42 | 10:42 | 10:35 | 10:27 | 10:27 | 10:32 |
| 27 | 10:42 | 10:42 | 10:35 | 10:27 | 10:27 | 10:32 |
| 28 | 10:42 | 10:42 | 10:35 | 10:27 | 10:27 | 10:33 |
| 29 | 10:43 | – | 10:34 | 10:27 | 10:27 | 10:33 |
| 30 | 10:43 | – | 10:34 | 10:27 | 10:27 | 10:33 |
| 31 | 10:43 | – | 10:34 | – | 10:27 | – |
| Day | Jul | Aug | Sep | Oct | Nov | Dec |
|---|---|---|---|---|---|---|
| 01 | 10:33 | 10:36 | 10:30 | 10:19 | 10:13 | 10:18 |
| 02 | 10:33 | 10:36 | 10:29 | 10:19 | 10:13 | 10:19 |
| 03 | 10:34 | 10:36 | 10:29 | 10:19 | 10:13 | 10:19 |
| 04 | 10:34 | 10:36 | 10:29 | 10:18 | 10:13 | 10:19 |
| 05 | 10:34 | 10:36 | 10:28 | 10:18 | 10:13 | 10:20 |
| 06 | 10:34 | 10:35 | 10:28 | 10:18 | 10:13 | 10:20 |
| 07 | 10:34 | 10:35 | 10:28 | 10:18 | 10:13 | 10:21 |
| 08 | 10:35 | 10:35 | 10:27 | 10:17 | 10:13 | 10:21 |
| 09 | 10:35 | 10:35 | 10:27 | 10:17 | 10:13 | 10:22 |
| 10 | 10:35 | 10:35 | 10:27 | 10:17 | 10:13 | 10:22 |
| 11 | 10:35 | 10:35 | 10:26 | 10:16 | 10:13 | 10:23 |
| 12 | 10:35 | 10:35 | 10:26 | 10:16 | 10:14 | 10:23 |
| 13 | 10:35 | 10:34 | 10:26 | 10:16 | 10:14 | 10:23 |
| 14 | 10:35 | 10:34 | 10:25 | 10:16 | 10:14 | 10:24 |
| 15 | 10:35 | 10:34 | 10:25 | 10:15 | 10:14 | 10:24 |
| 16 | 10:36 | 10:34 | 10:25 | 10:15 | 10:14 | 10:24 |
| 17 | 10:36 | 10:34 | 10:24 | 10:15 | 10:14 | 10:25 |
| 18 | 10:36 | 10:34 | 10:24 | 10:15 | 10:15 | 10:26 |
| 19 | 10:36 | 10:33 | 10:24 | 10:15 | 10:15 | 10:26 |
| 20 | 10:36 | 10:33 | 10:23 | 10:14 | 10:15 | 10:27 |
| 21 | 10:36 | 10:33 | 10:23 | 10:14 | 10:15 | 10:27** |
| 22 | 10:36 | 10:33 | 10:22 | 10:14 | 10:15 | 10:28 |
| 23 | 10:36 | 10:32 | 10:22* | 10:14 | 10:16 | 10:28 |
| 24 | 10:36 | 10:32 | 10:22 | 10:14 | 10:16 | 10:29 |
| 25 | 10:36 | 10:32 | 10:21 | 10:14 | 10:16 | 10:29 |
| 26 | 10:36 | 10:32 | 10:21 | 10:14 | 10:17 | 10:30 |
| 27 | 10:36 | 10:31 | 10:21 | 10:13 | 10:17 | 10:30 |
| 28 | 10:36 | 10:31 | 10:20 | 10:13 | 10:17 | 10:31 |
| 29 | 10:36 | 10:31 | 10:20 | 10:13 | 10:18 | 10:31 |
| 30 | 10:36 | 10:30 | 10:20 | 10:13 | 10:18 | 10:32 |
| 31 | 10:36 | 10:30 | – | 10:13 | – | 10:32 |
Clarifications:
[1]: Year specified: 2022.
[2]: All times are in UTC. Time Zone Offset: 28.03-30.10 UTC+3/31.10-27.03 UTC+2 Europe/Athens
[3]: * Solar Spring/Autumnal Equinox/** Summer/Winter Soltice.
[1]: Root microbiome along an altitude gradient of the lithophytic Ramonda heldreichii, an endemo-relict species of Mount Olympus [Preprint research paper]
[https://ssrn.com/abstract=4924858]
[2]: Microbiome analysis of the lithophytic resurrection plant Ramonda heldreichii, reveals root driven tight-rhizosphere vs elevation specific loose-rhizosphere communities
[Full research paper]