../
about/
projects/cs/
repository/
support/
contact/
Laboratory’s involvement in scientific research has become a means of encouraging curiosity and greater understanding of science while providing an unprecedented engagement between professional scientists and the general public.
The Globe Program® promotes full and open sharing of its data for educational and scientific purposes. Citizens and scientists are working together collecting data to investigate how the Earth function as a system. ~/tinycore.lab is interested in take measurements of environment and biodiversity on mt. Olympus National Park and explore alpine ecosystem’s complexity.
You’re always welcome to participate and contribute as a citizen scientist, educator, student or STEM professional to take part in a dynamic Earth science research mission. Find a Globe Team or join us! If you want to contribute, set up your account by becoming a member, complete in-person and/or e-training and contact us to get your referral code!
Team/Observations: tinycore lab
Organization: Greece GLOBE v-School
Account status:
GLOBE Educator: Athanasios Theodorakopoulos
Citizen Scientists: Maria Karava, Marios Patsouras, Dimitra Bika, Ioannis Karafyllias, Georgia Patsoura, Eleana Theodorakopoulou, Anastasios Nikas, Dimitrios Despoiniadis, Anna Theodorakopoulou, Thomais Theodorakopoulou, Jonathan Deroo, Vasileios Deligiannis, Stefanos Semertzidis.
Training history:
| Module | Sphere | Completed |
|---|---|---|
| Introduction to GLOBE | n/a | 14.03.20 |
| Introduction to Atmosphere | Atmosphere | 22.03.20 |
| Clouds | Atmosphere | 22.03.20 |
| Surface Temperature | Atmosphere | 22.03.20 |
| Air Temperature | Atmosphere | 23.03.20 |
| Precipitation-Rain | Atmosphere | 25.03.20 |
| Relative Humidity | Atmosphere | 26.03.20 |
| Barometric Pressure | Atmosphere | 26.03.20 |
| Precipitation-Snow | Atmosphere | 01.04.20 |
| Aerosols | Atmosphere | 01.04.20 |
| Introduction to Hydrosphere | Hydrosphere | 15.04.20 |
| Water Temperature | Hydrosphere | 15.04.20 |
| Water pH | Hydrosphere | 16.04.20 |
| Alkalinity | Hydrosphere | 16.04.20 |
| Electrical Conductivity | Hydrosphere | 16.04.20 |
| Water Transparency | Hydrosphere | 18.04.20 |
| Salinity | Hydrosphere | 16.09.20 |
| Dissolved Oxygen | Hydrosphere | 17.09.20 |
| Nitrates | Hydrosphere | 18.09.20 |
| Mosquito Larvae | Hydrosphere | 18.09.20 |
| Introduction to Biosphere | Biosphere | 20.09.20 |
| Land Cover Classification | Biosphere | 20.09.20 |
| Biometry-Tree Circumference | Biosphere | 20.09.20 |
| Biometry-Canopy/Ground Cover | Biosphere | 20.09.20 |
| Biometry-Graminoid/Tree/Shrub Height | Biosphere | 22.09.20 |
| Biometry-Graminoid Biomass | Biosphere | 24.02.21 |
| Green Up-Green Down/Grass Green-Up | Biosphere | 24.02.21 |
| Green Up-Green Down/Tree/Shrub Green-Up | Biosphere | 24.02.21 |
| Green Up-Green Down/Grass Green-Down | Biosphere | 24.02.21 |
| Green Up-Green Down/Tree/Shrub Green-Down | Biosphere | 24.02.21 |
| Carbon Cycle Introduction | Biosphere | 05.11.23 |
| Standard Site Carbon Cycle Protocols | Biosphere | 05.11.23 |
| Non-Standard Site Carbon Cycle Protocols | Biosphere | 05.11.23 |
| Carbon Cycle Modeling | Biosphere | 05.11.23 |
| Introduction to Pedosphere | Pedosphere | 05.11.23 |
| Soil Temperature | Pedosphere | 05.11.23 |
| Soil Moisture [SMAP] | Pedosphere | 05.11.23 |
| Soil Moisture [Gravimetric] | Pedosphere | 27.08.24 |
| Soil Characterization | Pedosphere | 20.12.24 |
Data site locations:
| GLOBE Site | Sphere* | Activated | GLOBE Vis Sys |
|---|---|---|---|
| Research Area: LIT-193420S1 | [1] [2] [4] | 22.03.20 | Data |
| Research Area: LIT-193453S2 | [1] [2] | 23.03.20 | Data |
| Research Area: LIT-193799S3 | [1] [4] | 26.03.20 | Data |
| Research Area: LIT-216587S4 | [1] [2] [3] [4] | 09.04.20 | Data |
| Research Area: LIT-216669S5 | [1] [2] | 09.09.20 | Data |
| Research Area: LIT-218186S6 | [1] [2] [4] | 20/09/20 | Data |
| Research Area: LIT-220209S7 | [2] | 22/10/20 | Data |
*[1] Atmosphere, [2] Biosphere, [3] Hydrosphere, [4] Pedosphere
Monthly summaries of daily data [air temperature/humidity/precipitation]: met-data
The instrument shelter protects the instruments from direct sunlight, precipitation, and other external factors, allowing for consistent and precise data collection. It provides ventilation to allow for accurate air temperature and humidity readings while shielding the instruments from wind, which could cause erratic readings. It has been built according to the GLOBE Program’s standards, ensuring that it meets the necessary requirements, such as the construction materials, the height at which the instruments are placed and its location away from buildings, trees and other obstacles.
Specifications:
| Station Index ID | 193799 | GLOBE Site | Research Area: LIT-193799S3 |
| Latitude | 40.096737° |
| Longitude | 22.497476° |
| Grid Square Locator | KN10fc |
| Elevation | 400.0m |
| Field code | MUC 93 |
| Type | Conventional |
| Observations | Data [Online] |
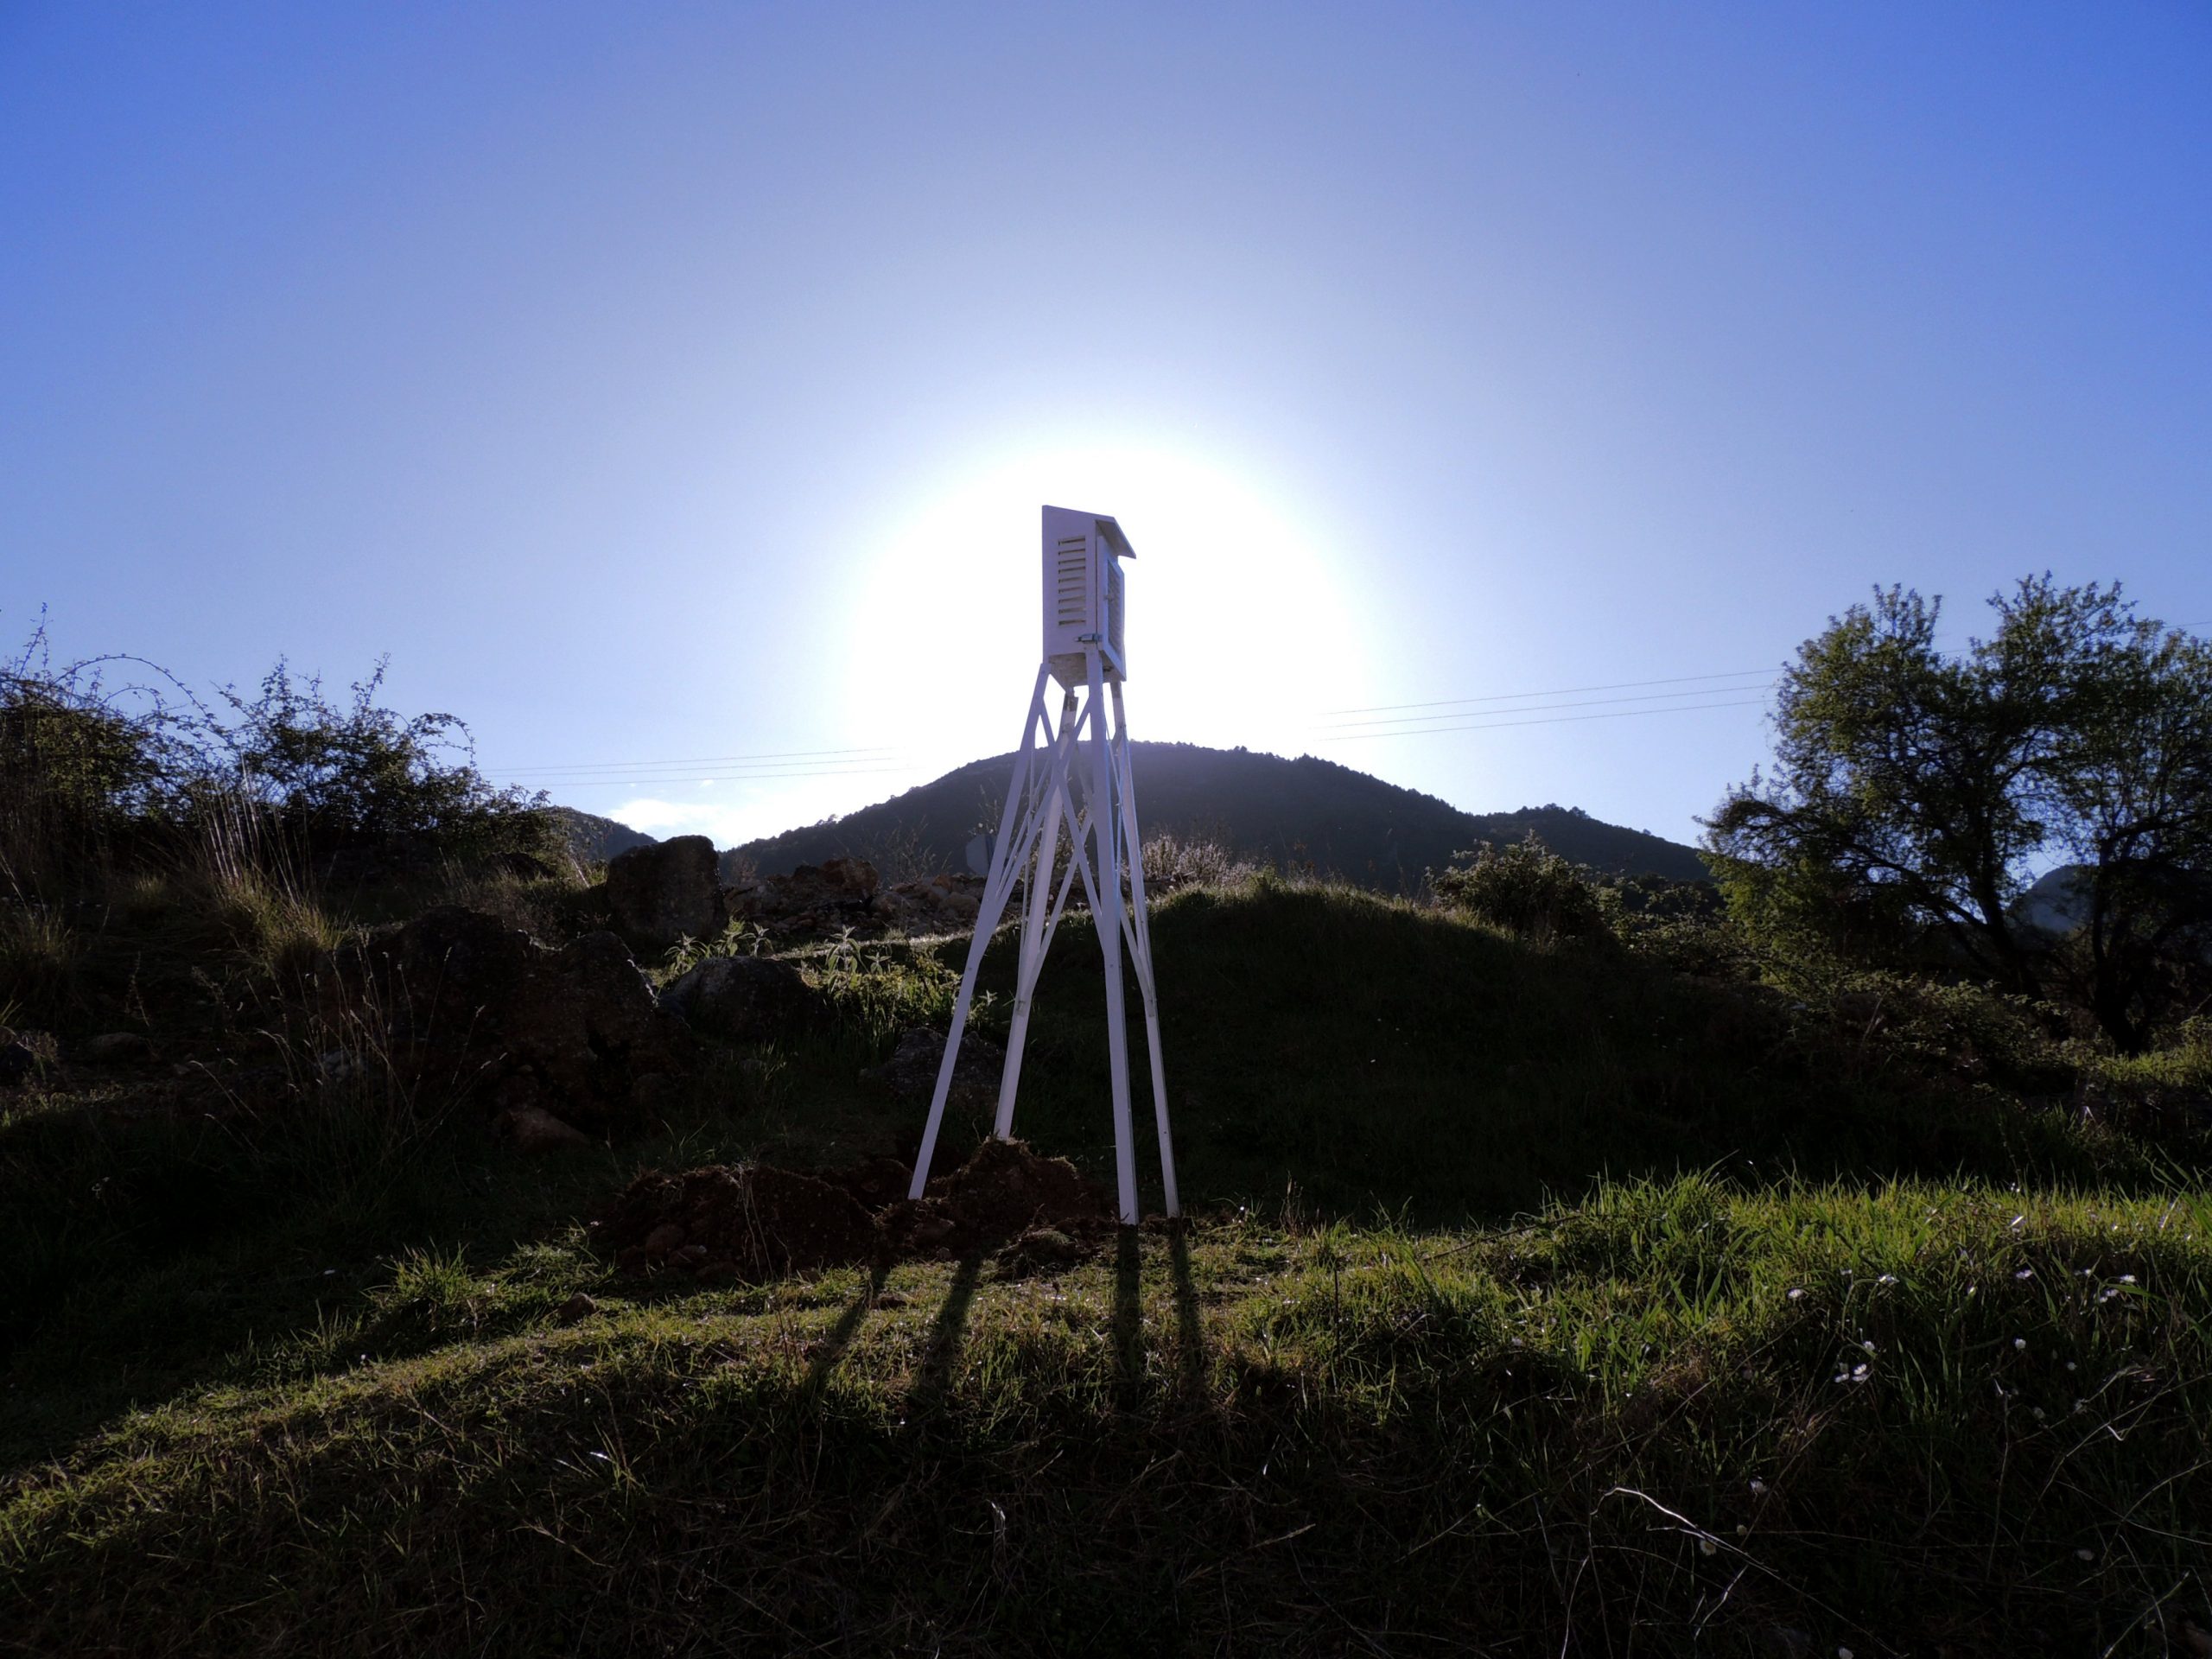
[Laboratory’s instrument shelter installation which is used in atmosphere measurements – Research Area: LIT-193799S3]
Clouds:
Taking cloud observations is crucial for understanding Earth’s climate and weather patterns. Clouds play a significant role in regulating the planet’s temperature by reflecting sunlight and trapping heat. Different types of clouds have different effects, and the amount of cloud cover is also important. Clouds can change rapidly, so frequent observations are useful to track these changes.By observing cloud types, coverage, and altitude, scientists can gain insights into local and global weather systems, improve climate models and study the effects of clouds on energy balance. Additionally, cloud data contributes to better forecasting and helps monitor environmental changes over time. By matching observations from the ground with satellite data, scientists can validate and improve satellite algorithms, leading to better cloud detection and classification. This collaboration provides a more comprehensive understanding of cloud properties, such as their type, altitude, and extent, which is essential for refining weather forecasts, climate models, and studying phenomena like climate change. The GLOBE Program encourages this matching process to ensure the reliability of both ground and satellite data, ultimately contributing to more precise environmental monitoring.
NASA Cloud observation and Satellite Match:
Sample plots of seasonal ground cloud observations featuring NASA Satellite Comparison.
| UTC Date/Time | Satellite | Dataset |
|---|---|---|
| 24.04.2020/10:25 | GEO/Terra | Data |
| 10.05.2020/10:27 | Terra | Data |
| 17.05.2020/10:24 | Terra | Data |
| 22.05.2020/10:33 | Aqua | Data |
| 27.05.2020/10:23 | GEO | Data |
| 04.06.2020/10:40 | GEO | Data |
| 05.06.2020/10:18 | GEO | Data |
| 23.06.2020/10:48 | GEO/Aqua | Data |
| 25.06.2020/11:09 | GEO | Data |
| 15.07.2020/10:16 | Terra | Data |
| 20.07.2020/10:31 | Terra | Data |
| 11.09.2020/10:38 | GEO/Aqua | Data |
| 29.03.2021/10:43 | GEO/Aqua | Data |
| 04.12.2022/10:20 | METEOSAT-11 [MSG-4] | Data |
| 03.12.2024/10:42 | METEOSAT-10 [MSG-3] | Data |
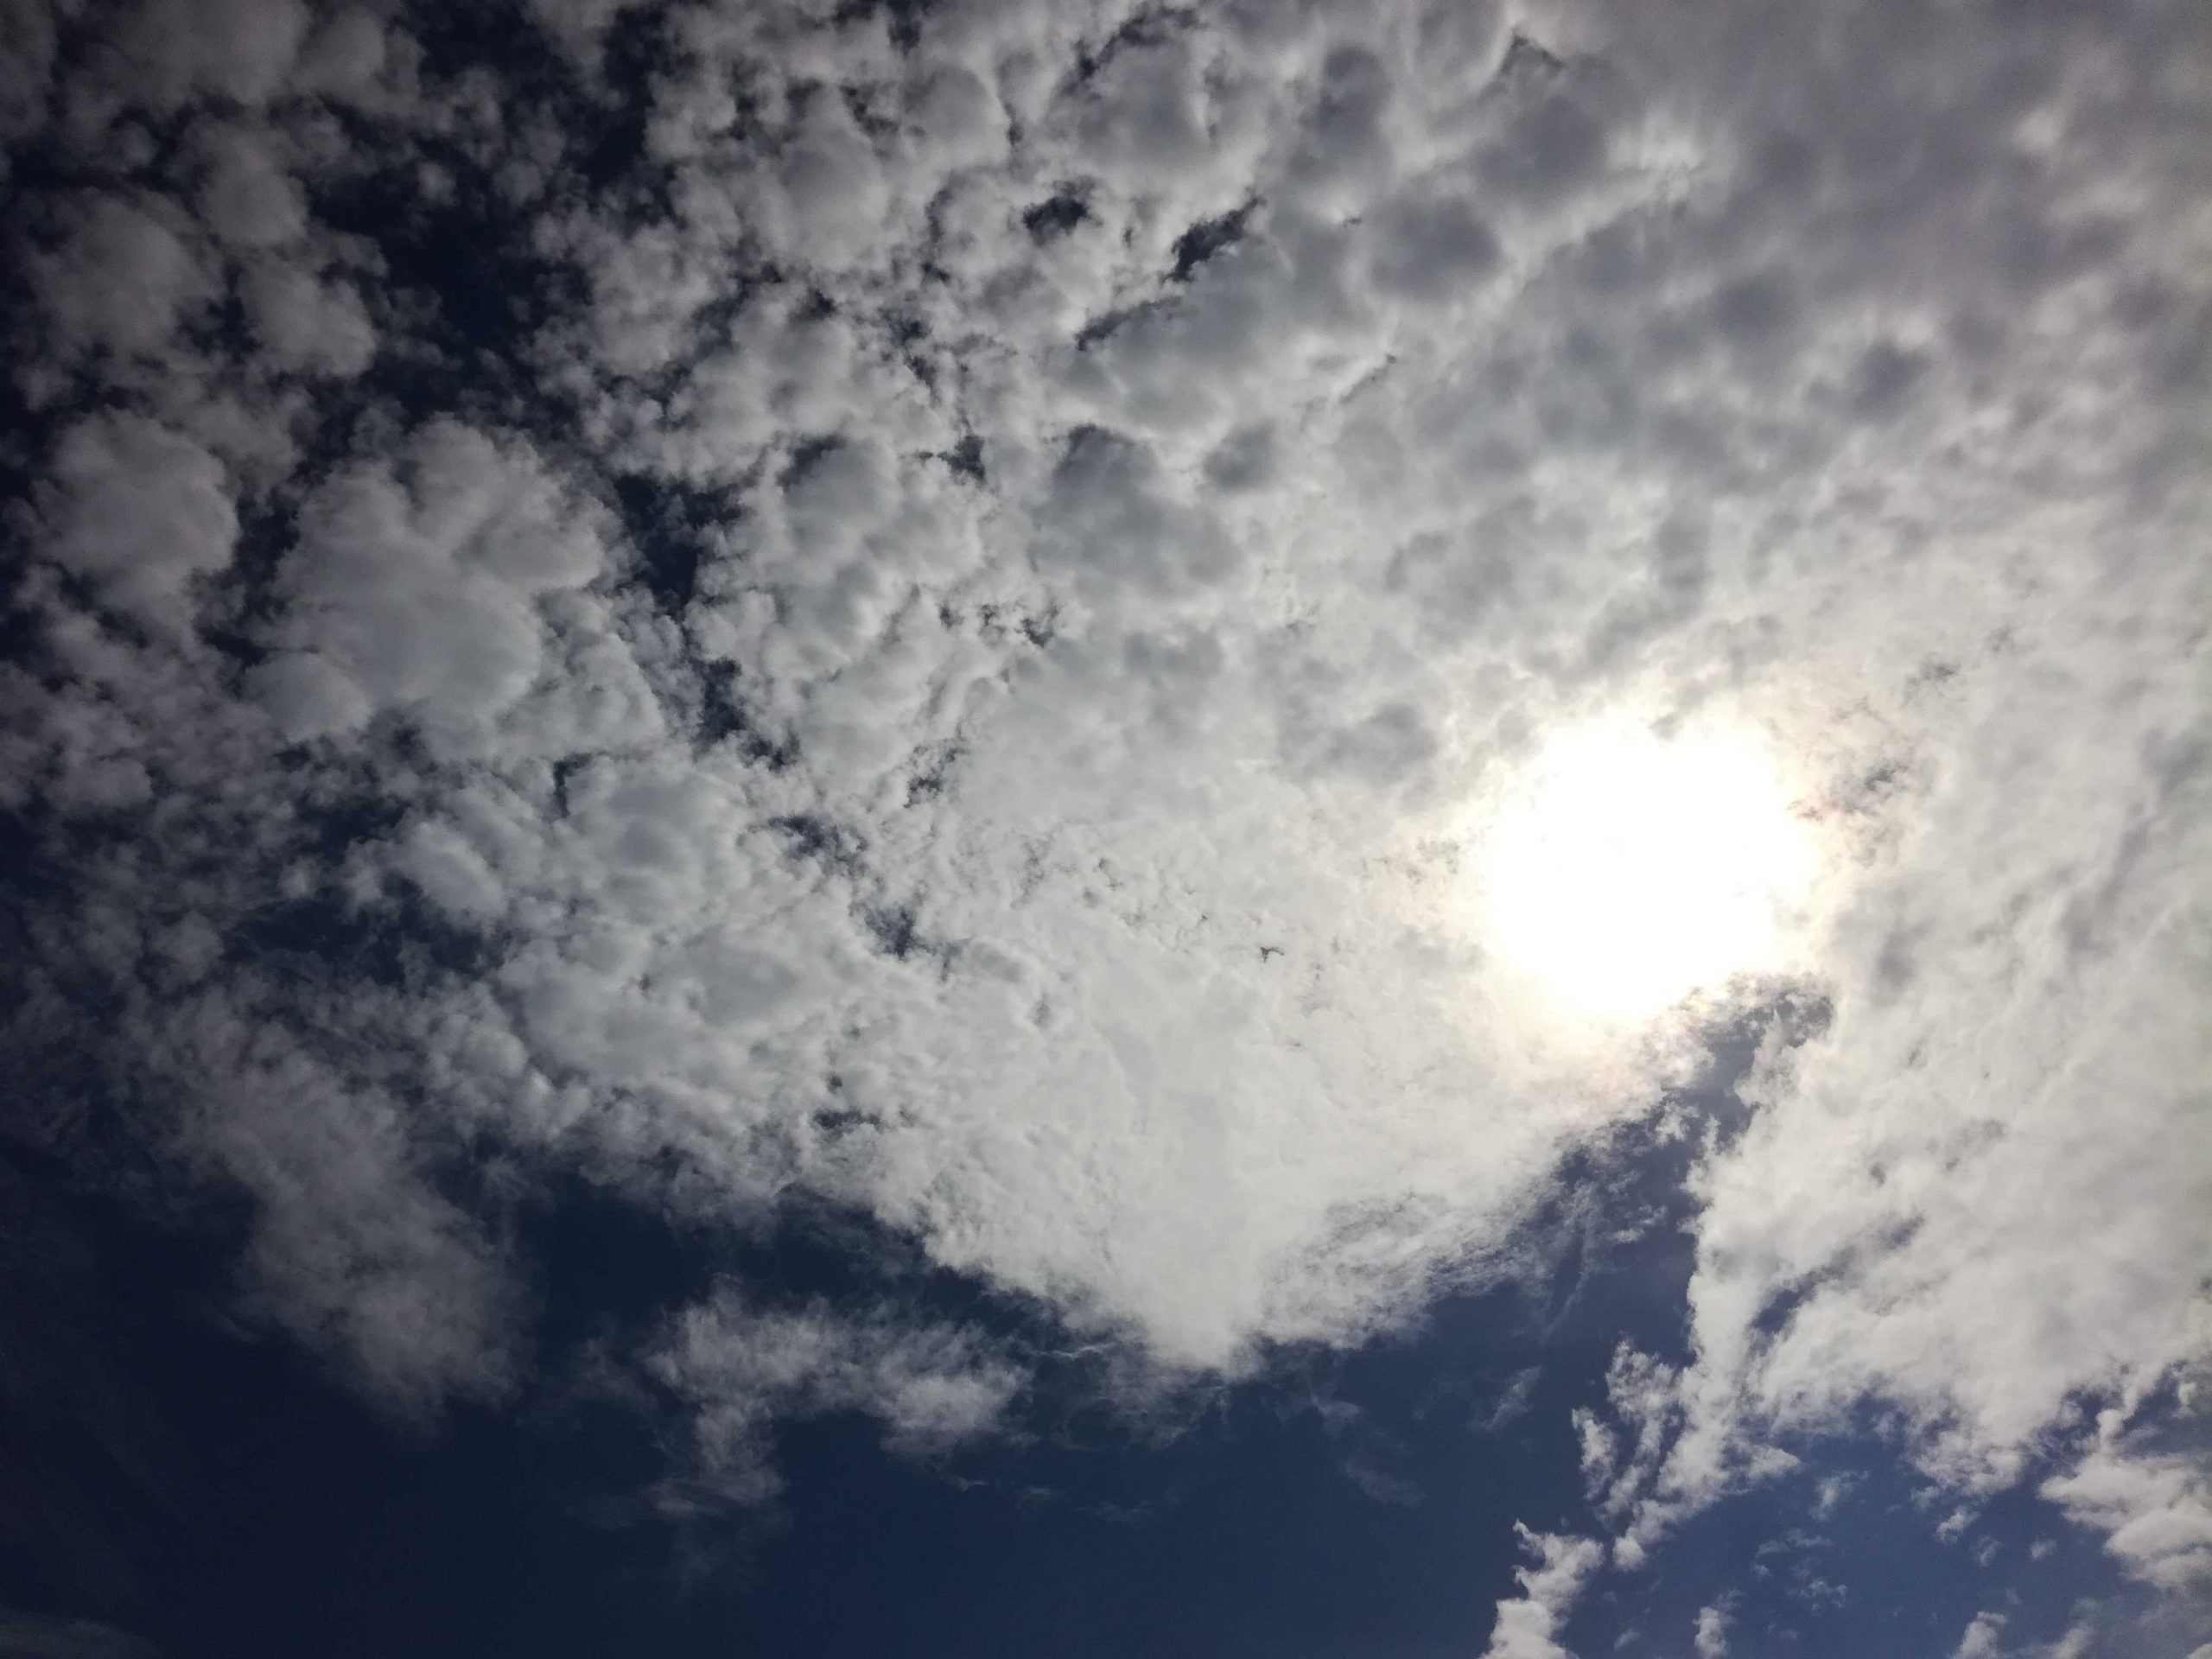
[Taking cloud observations at local solar noon – Research Area: LIT-193799S3]
Measuring and recording precipitation, including rain and snow, is crucial for understanding weather patterns, climate, and water resources. Precipitation data helps monitor the availability of fresh water, predict droughts or floods, and manage agricultural planning. It also plays a key role in studying climate change, as changes in precipitation patterns can indicate shifts in climate systems.
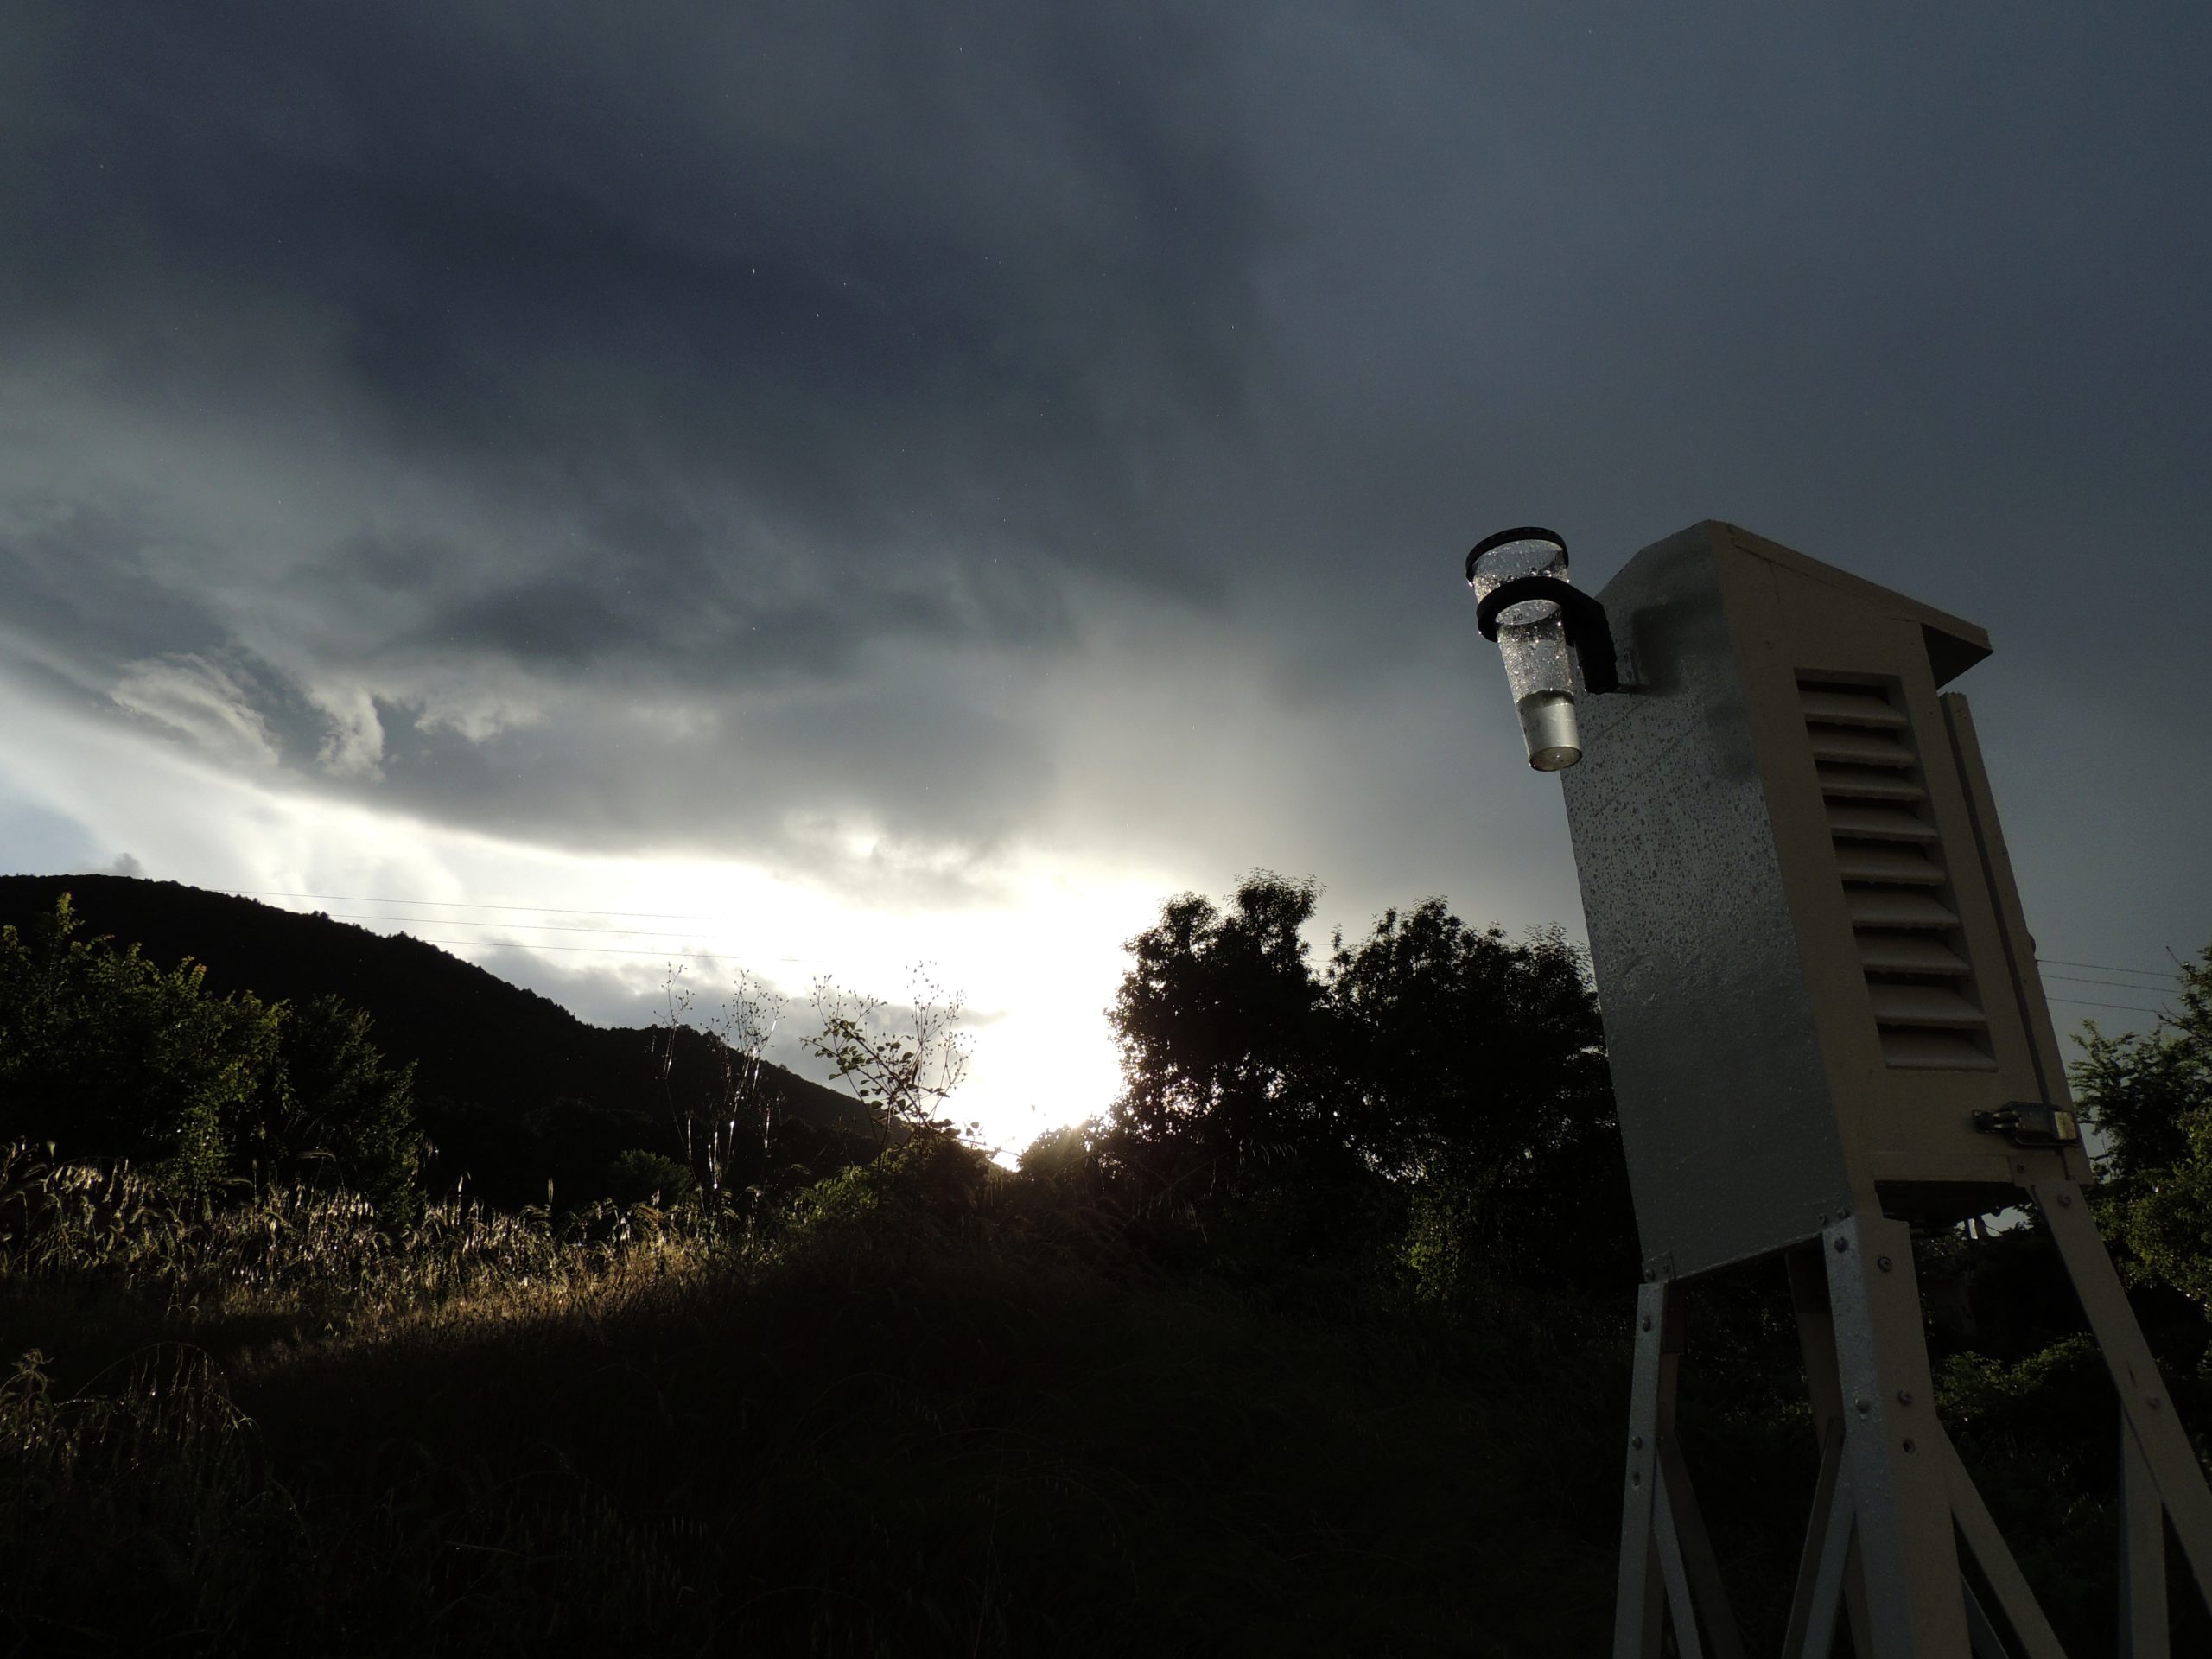
[Recording data during rainfall observation using rain gauge – Research Area: LIT-193799S3]
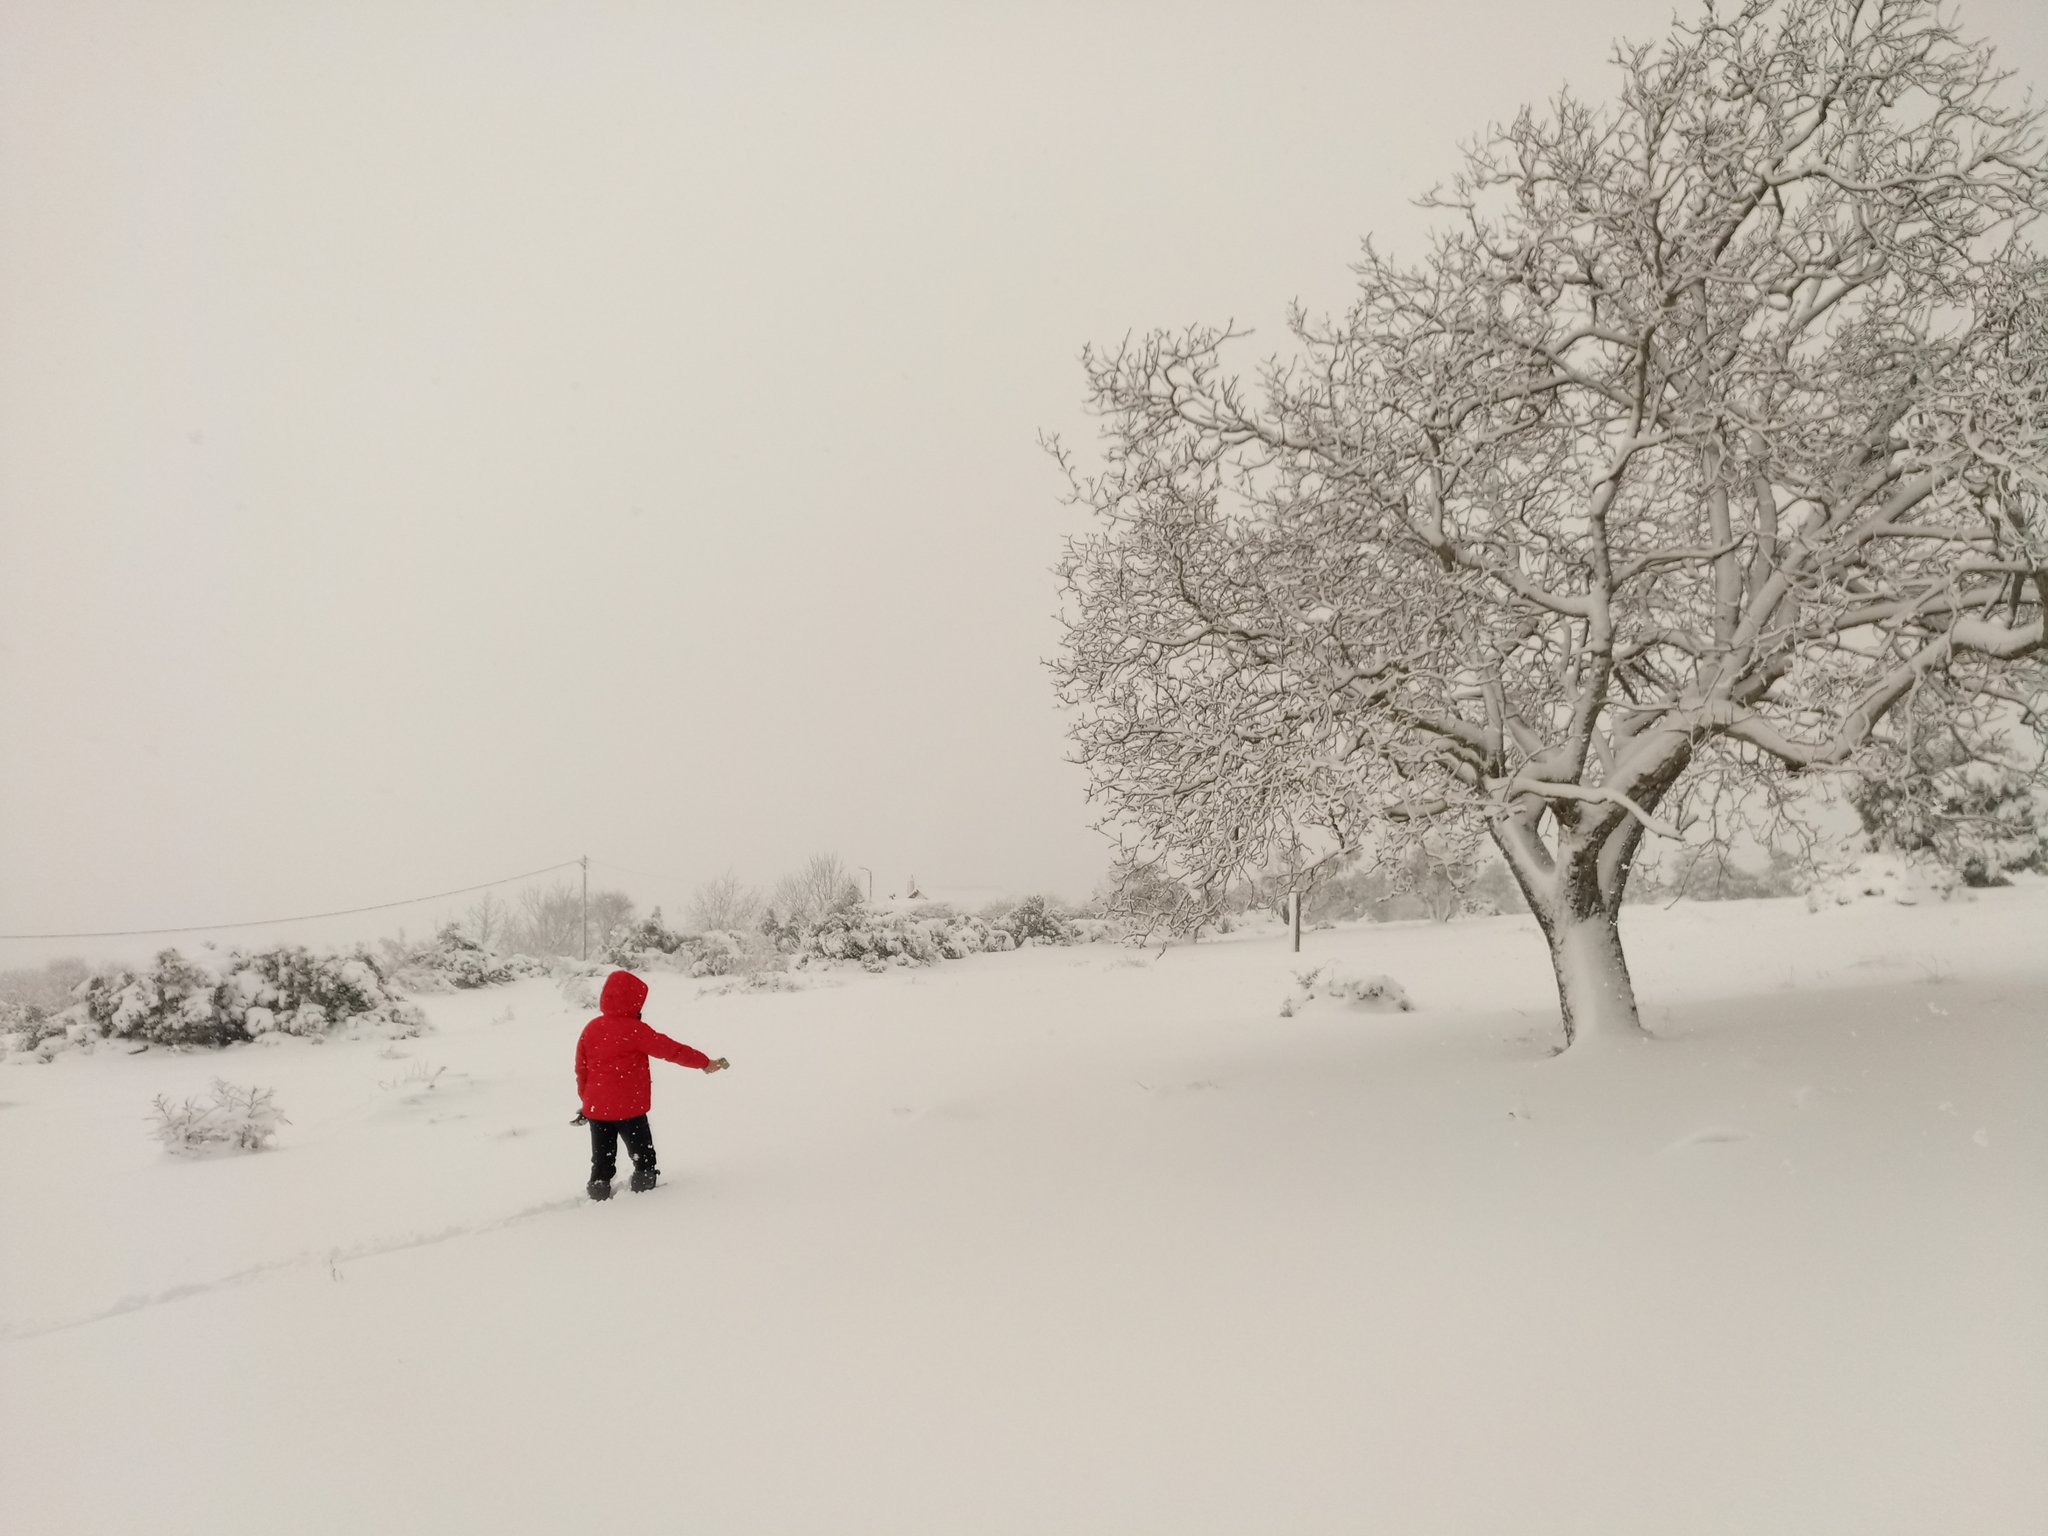
Accurate precipitation records are vital for improving weather forecasting, allowing for better preparation and response to extreme weather events. Additionally, tracking snowfall provides important information for managing water supplies, especially in regions where snowmelt is a major source of fresh water. Overall, these measurements are essential for managing natural resources, protecting ecosystems, and ensuring public safety.
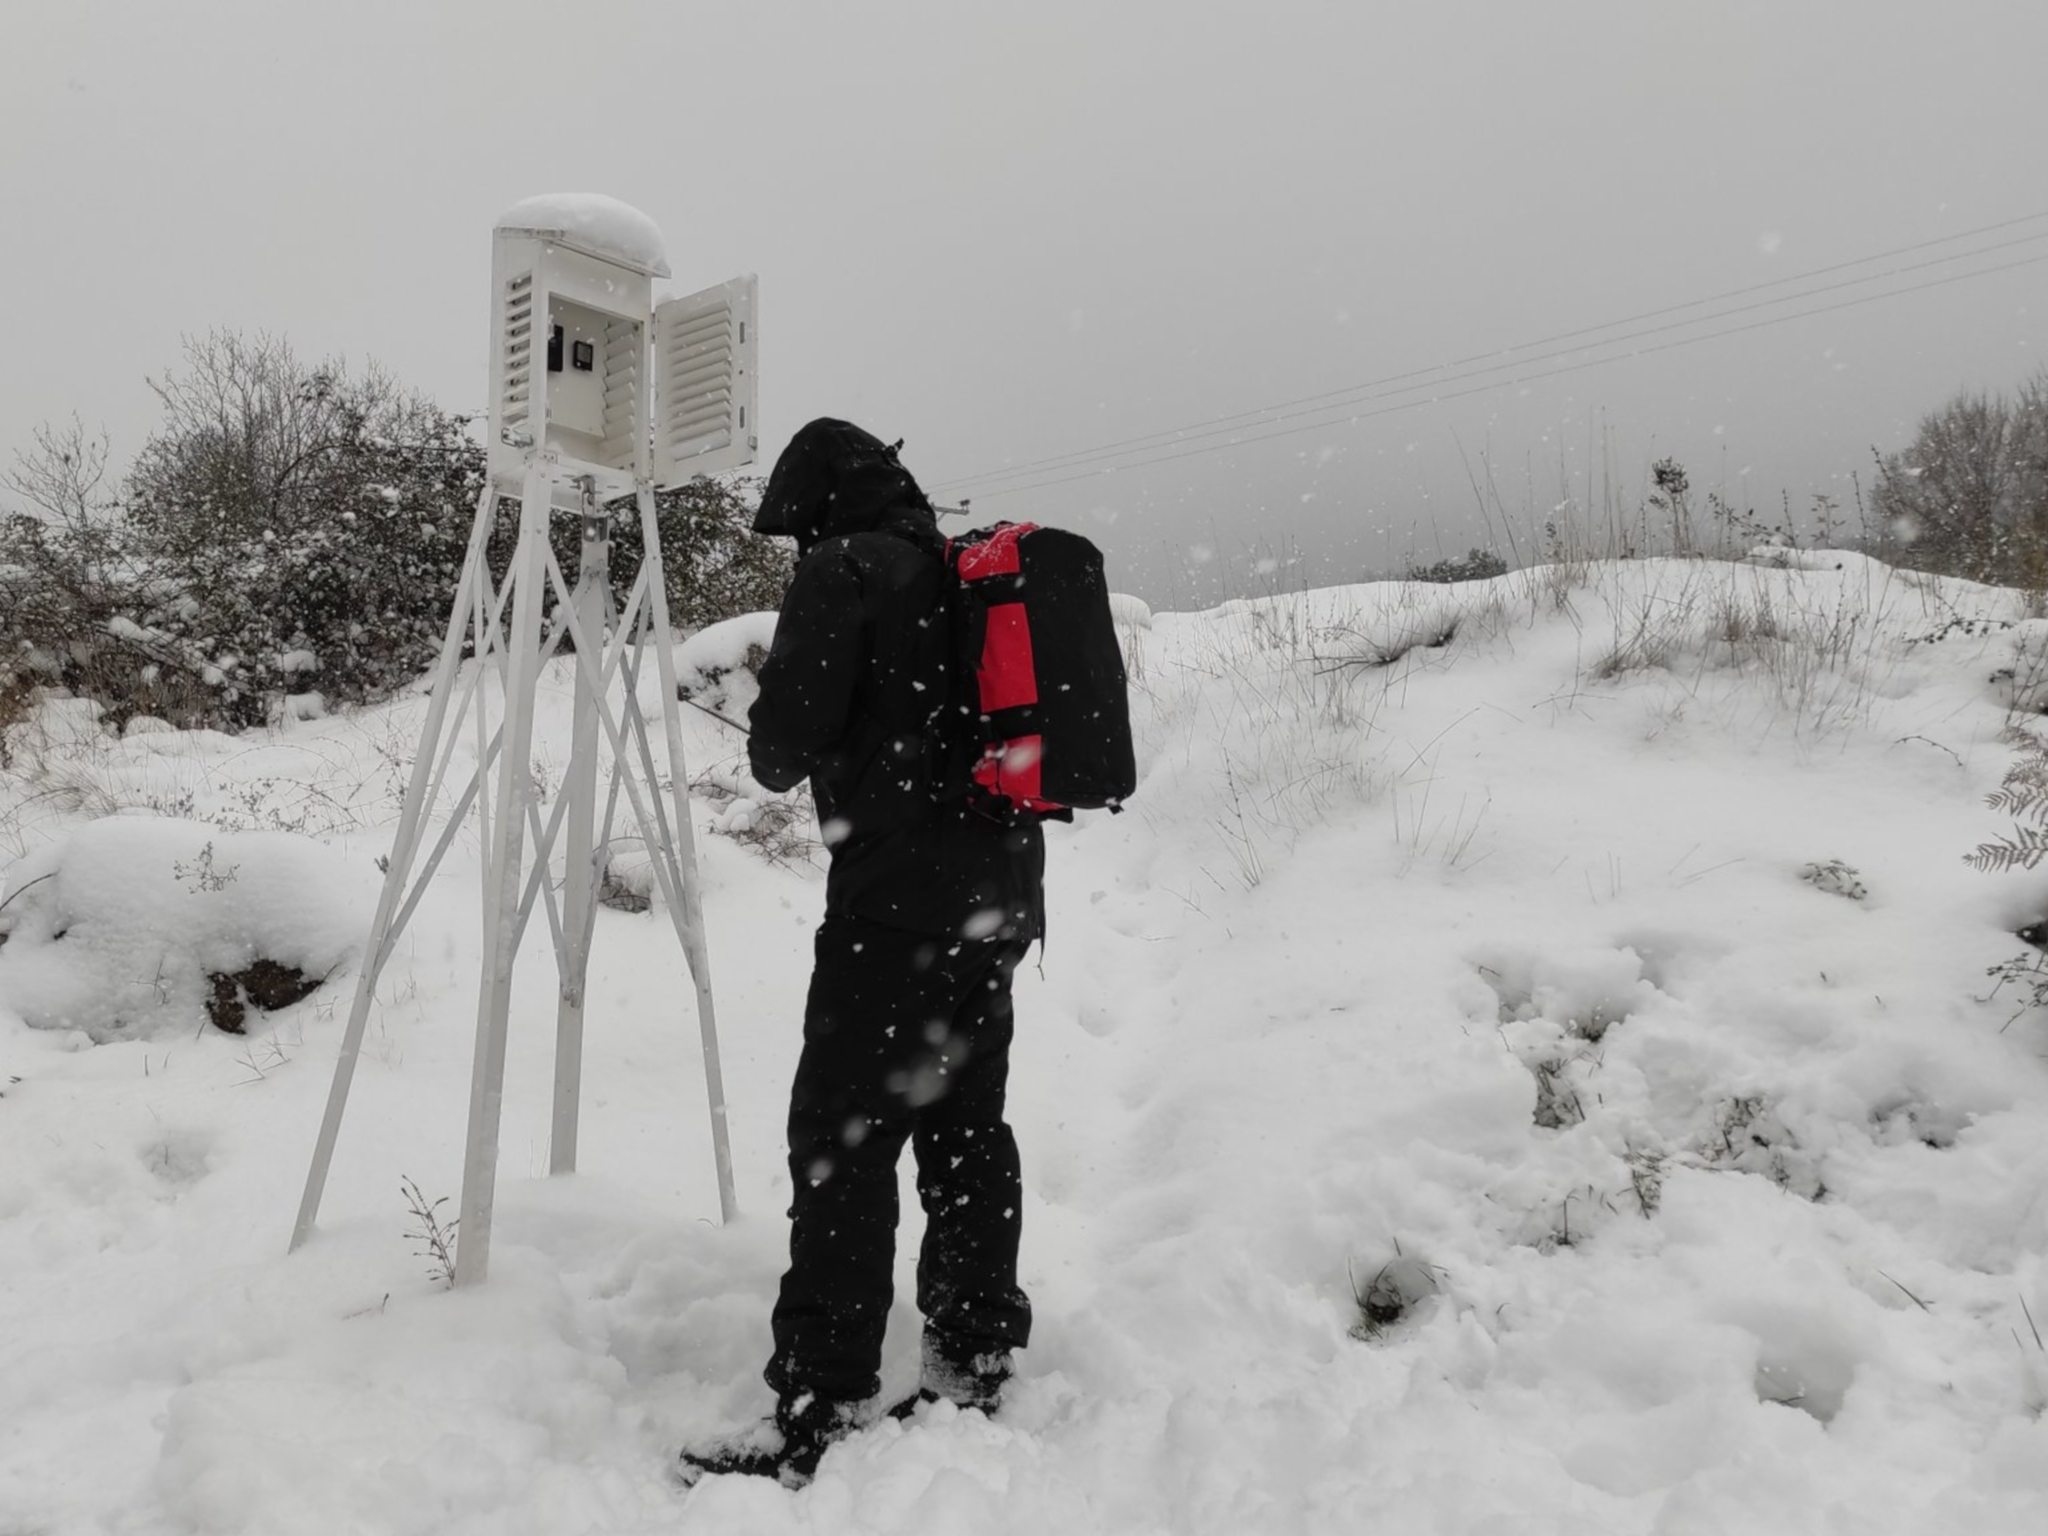
[Measuring precipitation [snow] – Research Area: LIT-193799S3]
Hydrosphere investigation:
Taking measurements of freshwater parameters like temperature, electrical conductivity, salinity, alkalinity, dissolved oxygen, nitrates, and pH is vital for monitoring water quality and understanding the health of aquatic ecosystems. Each of these measurements provides insights into different aspects of the water’s condition:
Temperature affects the metabolic rates of aquatic organisms and influences the solubility of gases like oxygen in water.
Electrical conductivity and salinity indicate the presence of dissolved salts and minerals, which can impact plant and animal life.
Alkalinity measures the water’s ability to neutralize acids, reflecting its buffering capacity and stability against pH changes.
Dissolved oxygen is critical for the survival of fish and other aquatic organisms; low levels can lead to “dead zones” where life cannot be sustained.
Nitrates are essential nutrients for plants but, in excess, can cause harmful algal blooms, leading to oxygen depletion and water quality degradation.
pH reflects the acidity or alkalinity of the water, with extreme levels being harmful to most aquatic life.
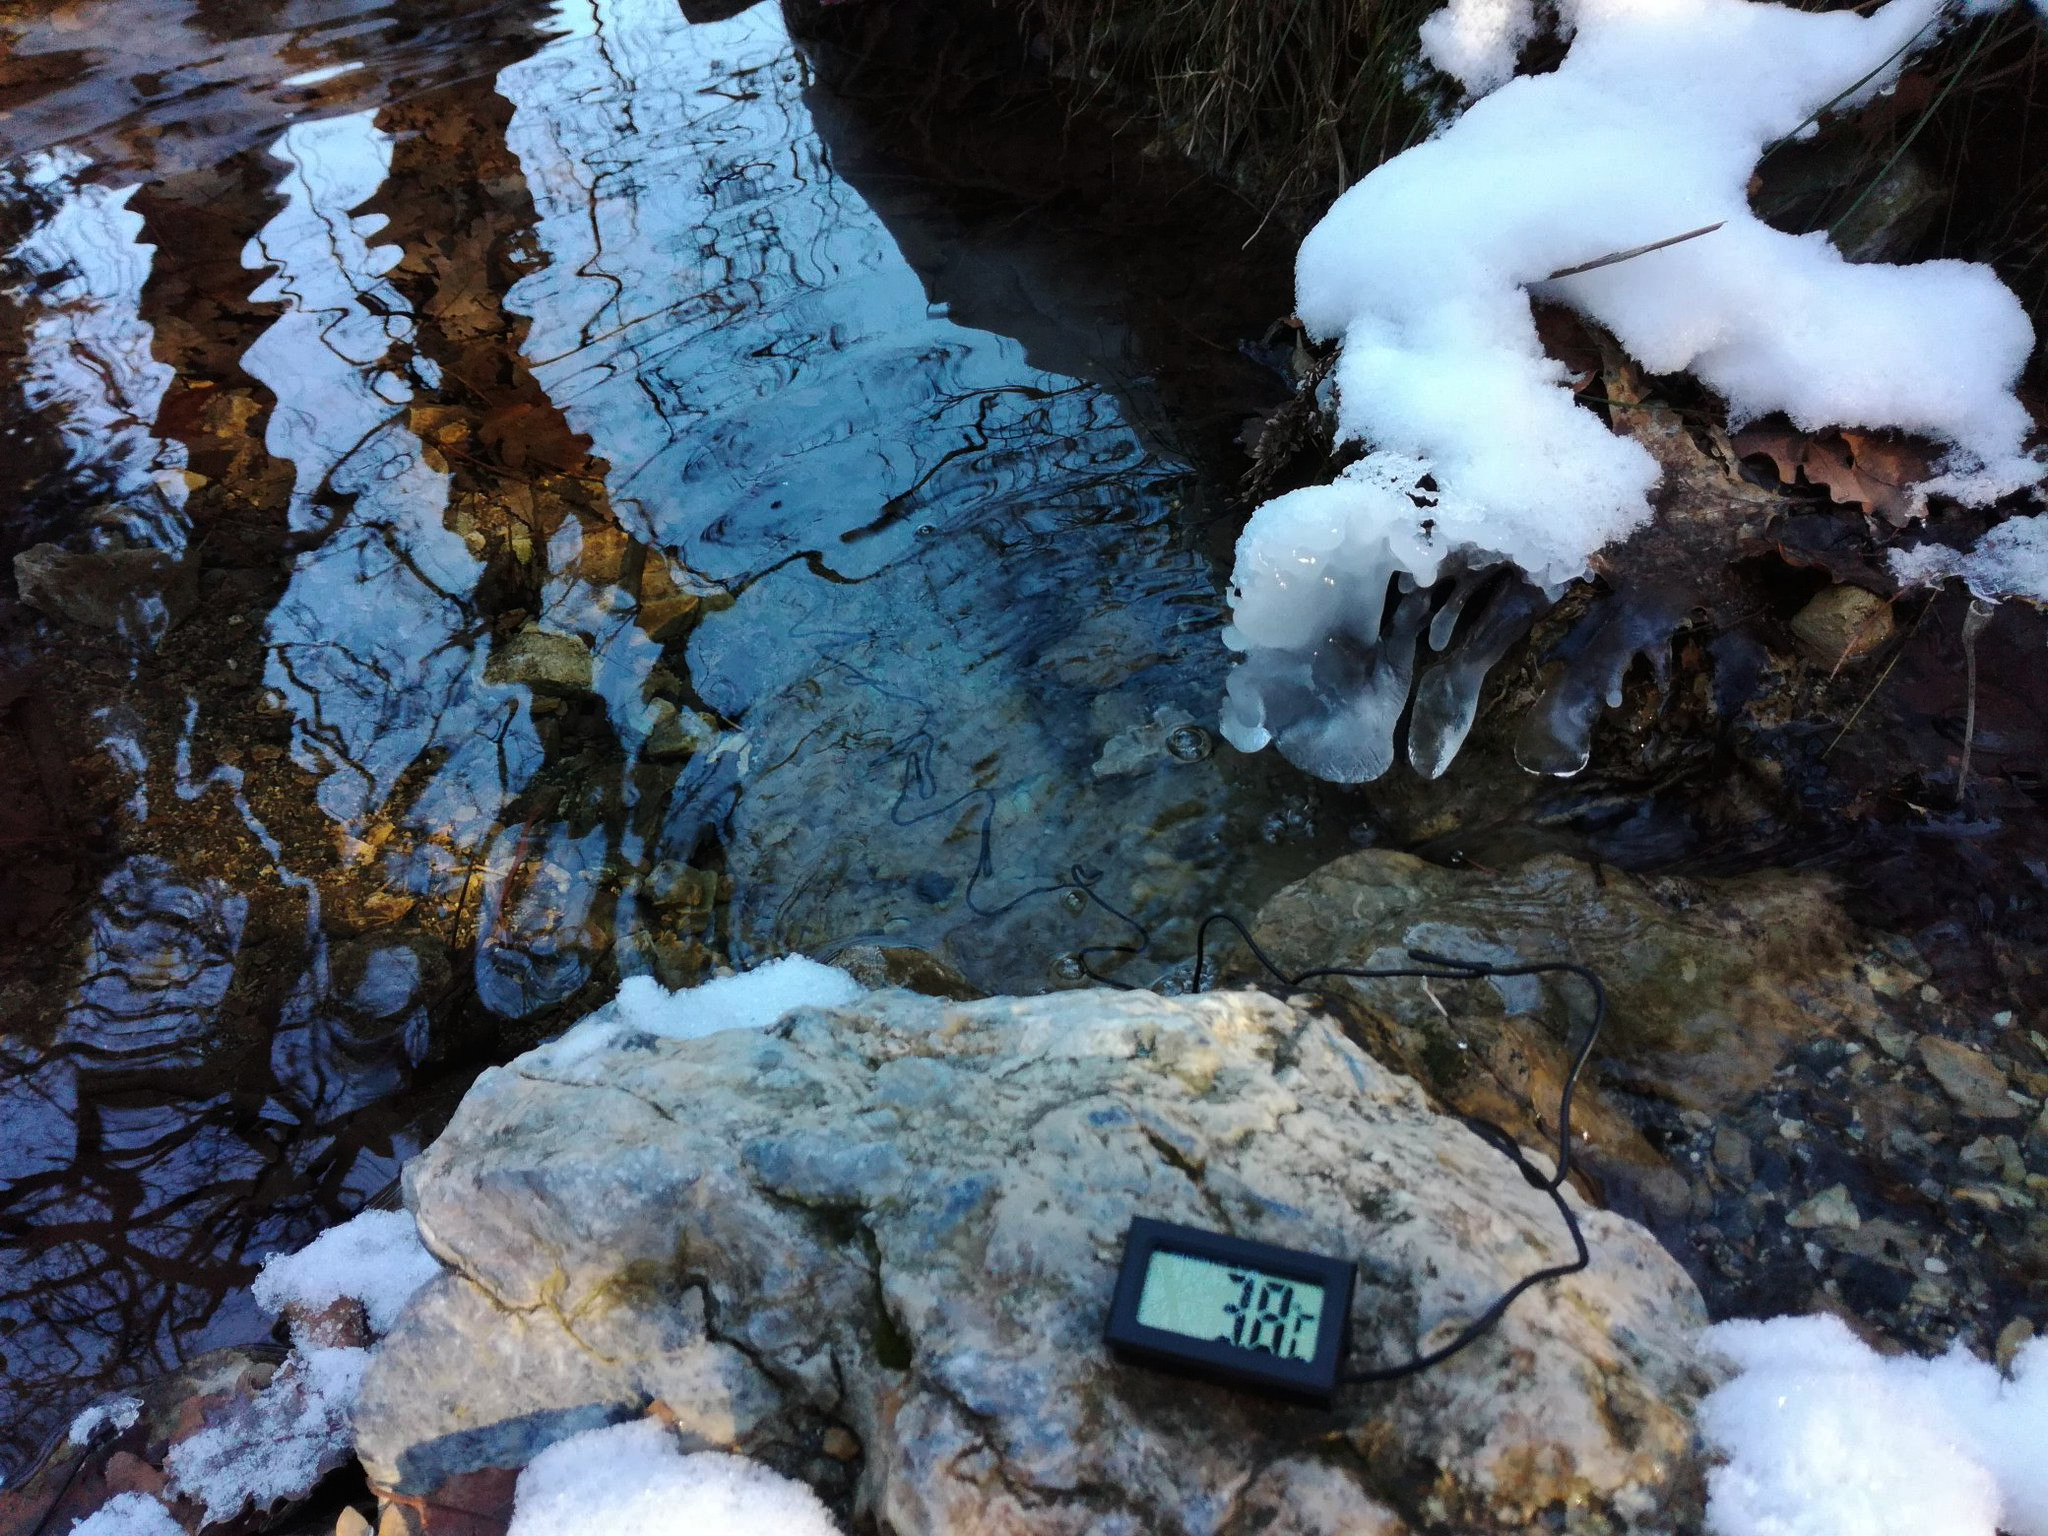
[Taking water temperature measurements – Research Area: LIT-216587S4]
Collecting and analyzing these measurements helps detect pollution, assess the impact of human activities, and guide conservation efforts. They are essential for ensuring that freshwater resources remain safe and sustainable for drinking, agriculture, recreation, and supporting diverse ecosystems.
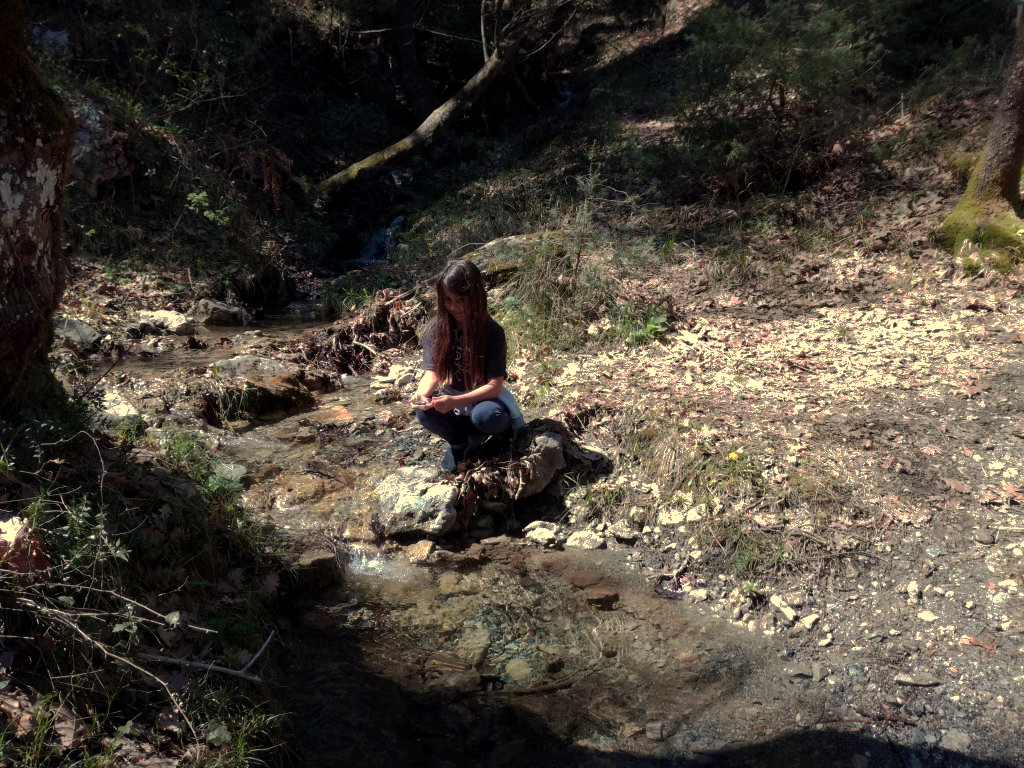
[Searching for water sample location in a perennial mountain stream running over limestone – Research Area: LIT-195967S4]
Land Cover:
Land Cover observations provide valuable data on the distribution and types of land surfaces, such as forests, grasslands, urban areas, and water bodies. By systematically recording and categorizing these land cover types, scientists can analyze changes in land use and land cover over time. This information is crucial for understanding the impacts of human activities and natural processes on ecosystems, climate, and biodiversity. It aids in tracking deforestation, urbanization, and habitat loss, and helps inform environmental management and conservation efforts. Additionally, land cover data supports climate modeling and helps assess the effects of land changes on local and global scales.
Land cover data is also essential for enhancing the accuracy and utility of mapping and satellite observations. By providing detailed information on the types and distribution of land surfaces, it helps calibrate and validate satellite imagery, ensuring that the data captured by satellites accurately reflects real-world conditions. Furthermore, land cover data supports the development of more sophisticated remote sensing algorithms and models, which can better interpret satellite images and detect subtle changes over time. This integration of ground-based observations with satellite data enhances our ability to monitor environmental changes, plan land use, and manage natural resources effectively.
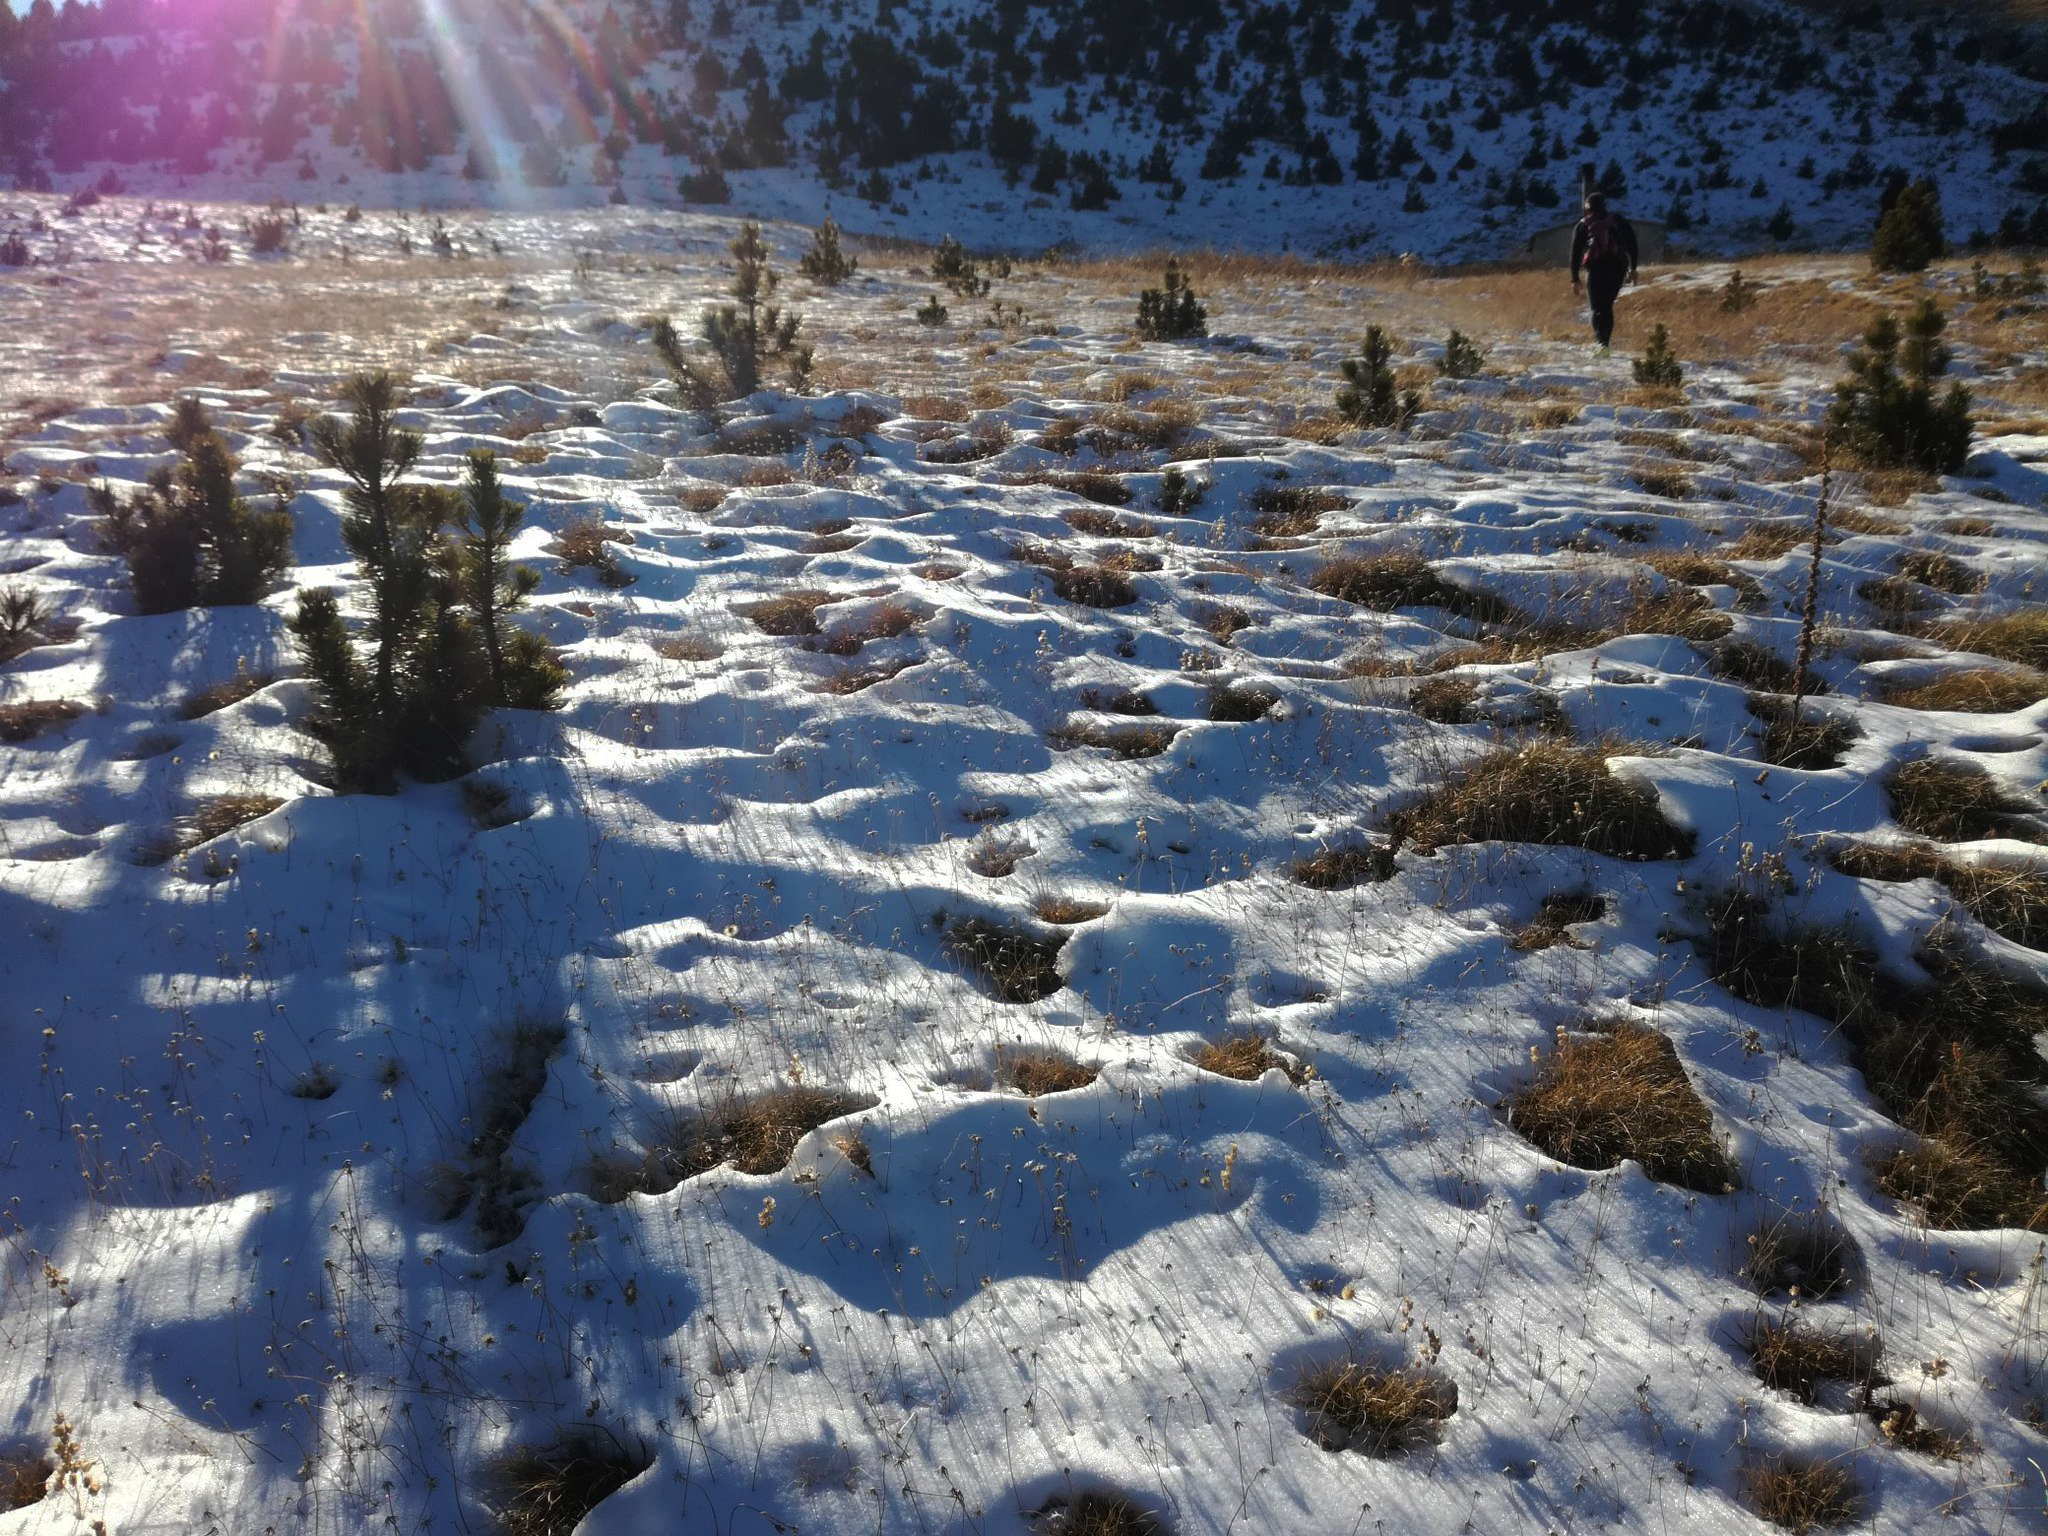
[Taking Land-Cover observation on mt.Olympus, Livadaki, 2086m. alt. – Research Area: LIT-216669S5]
Trees:
Trees are crucial for understanding forest health, carbon storage, and biodiversity. Tree height is a key indicator of a forest’s age, growth rate, and overall health, providing valuable data for studying how forests respond to environmental changes, such as climate change or deforestation.
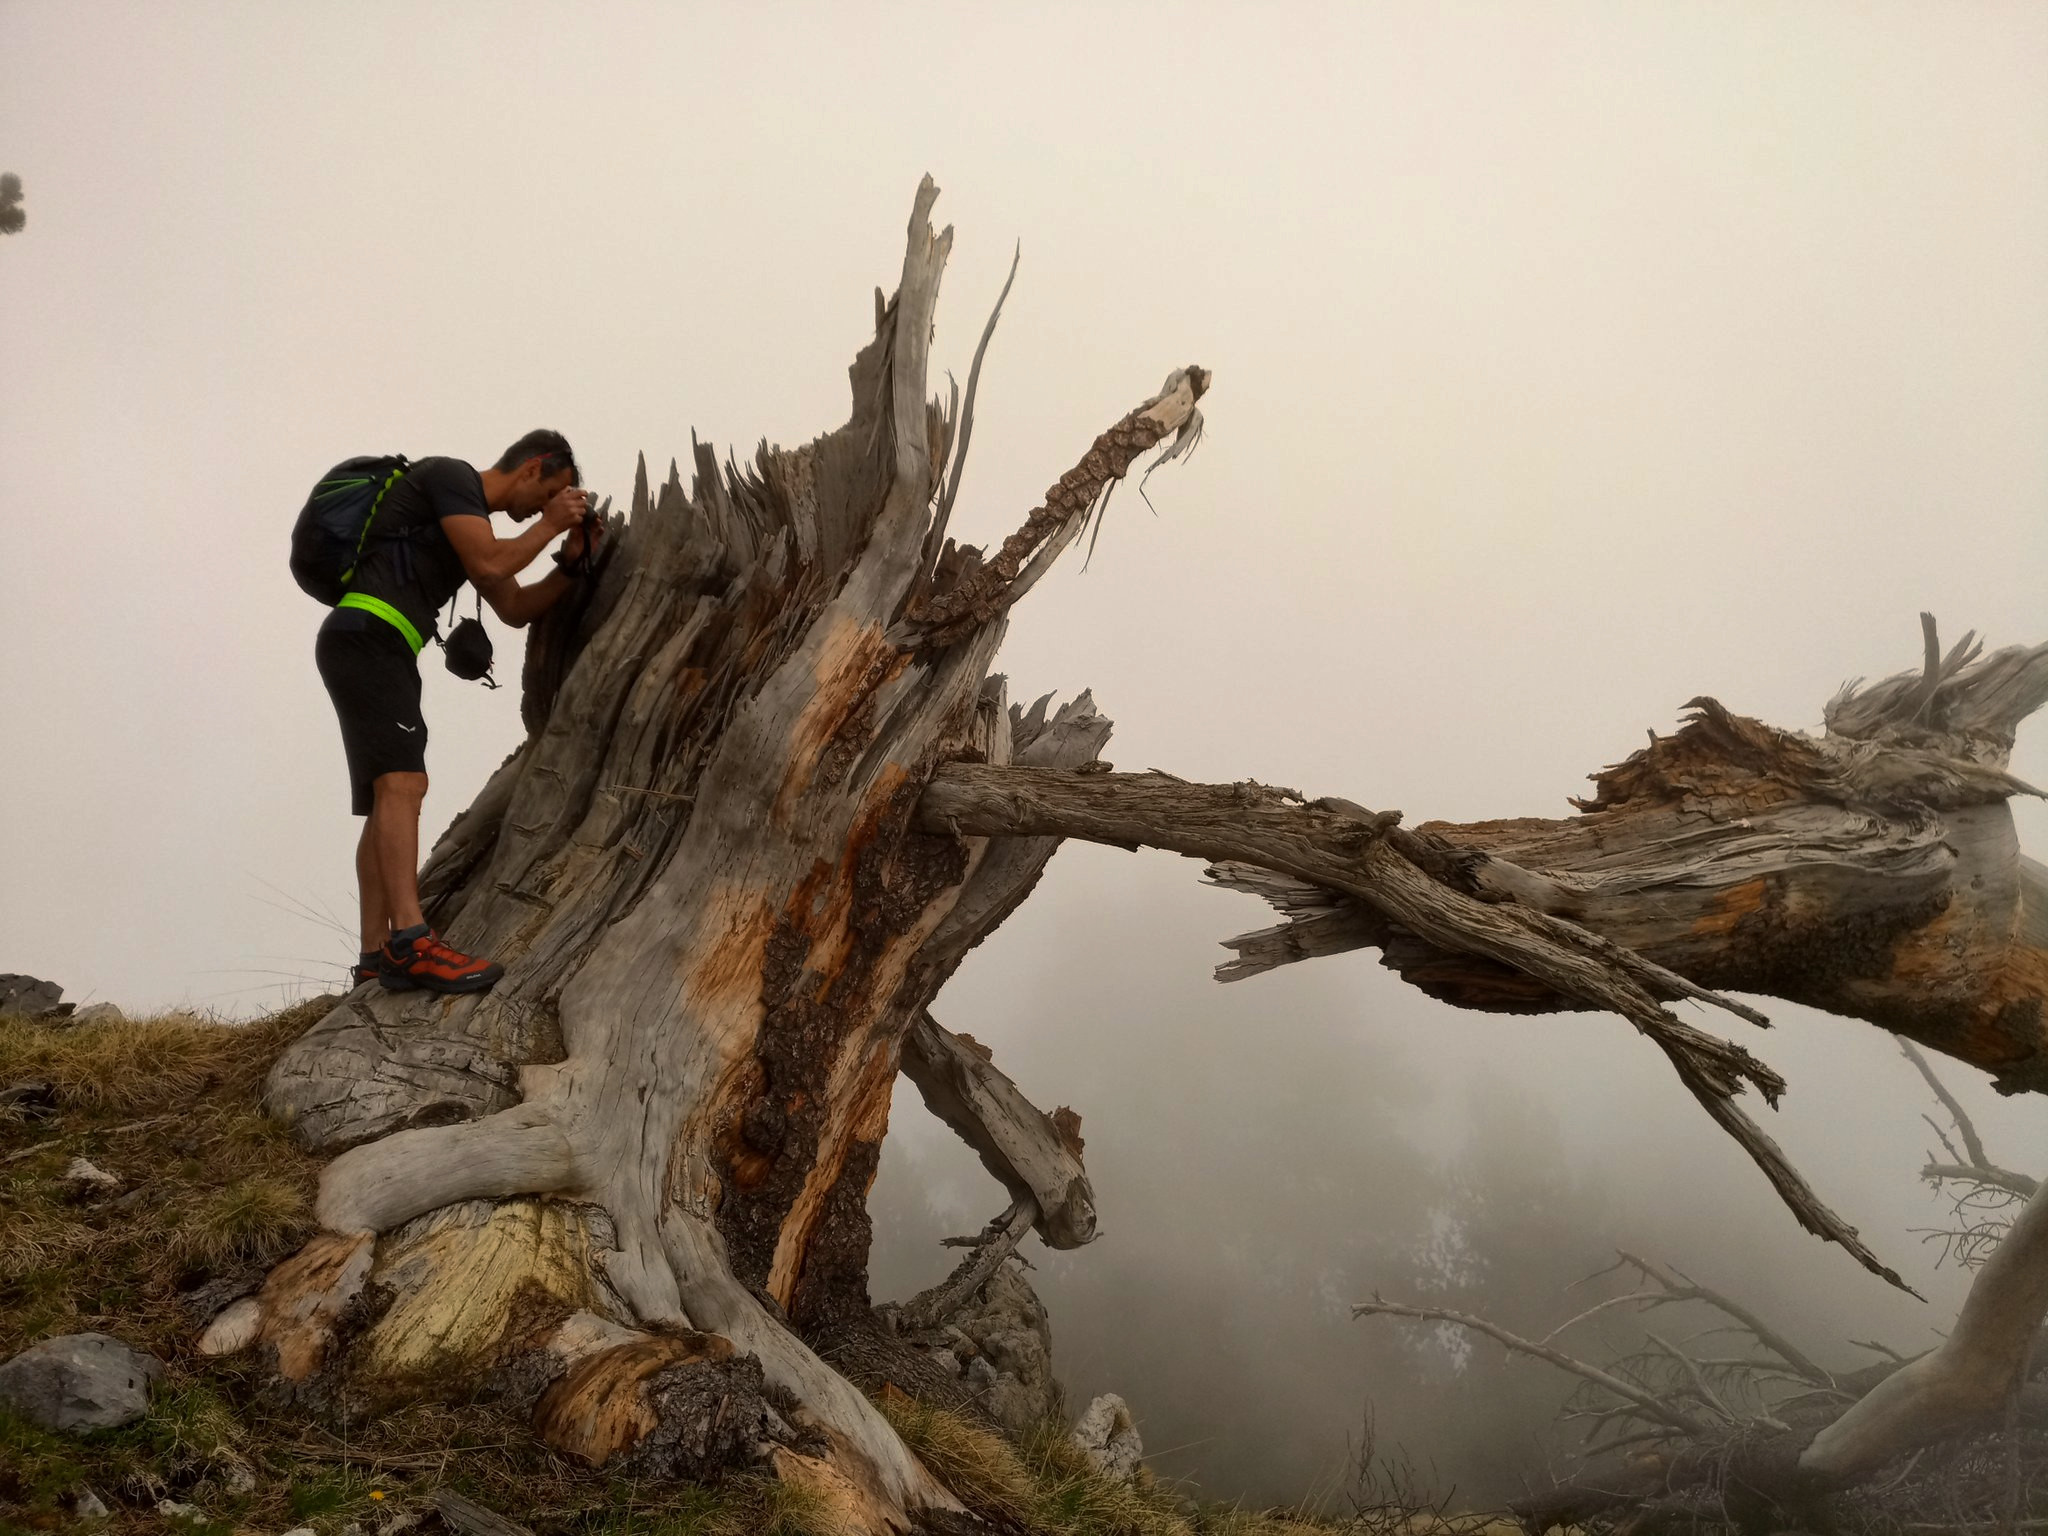
[Reaching the tree line in eastern slopes of mt. Olympus for ‘2021 Community Trees Challenge’]
These ground-based measurements are essential for validating and improving satellite-derived data on tree height and global tree canopy height. Satellites can estimate tree heights over large areas, but their accuracy depends on reliable ground truth data, like those provided by the GLOBE Program. By comparing these observations with satellite data, scientists can refine remote sensing algorithms, leading to more accurate global maps of forest structure. Improved satellite imagery of tree heights and canopy cover helps in assessing global carbon storage, as taller trees generally store more carbon. This data is also vital for monitoring deforestation, habitat loss, and climate change impacts, contributing to more informed forest management and conservation strategies.
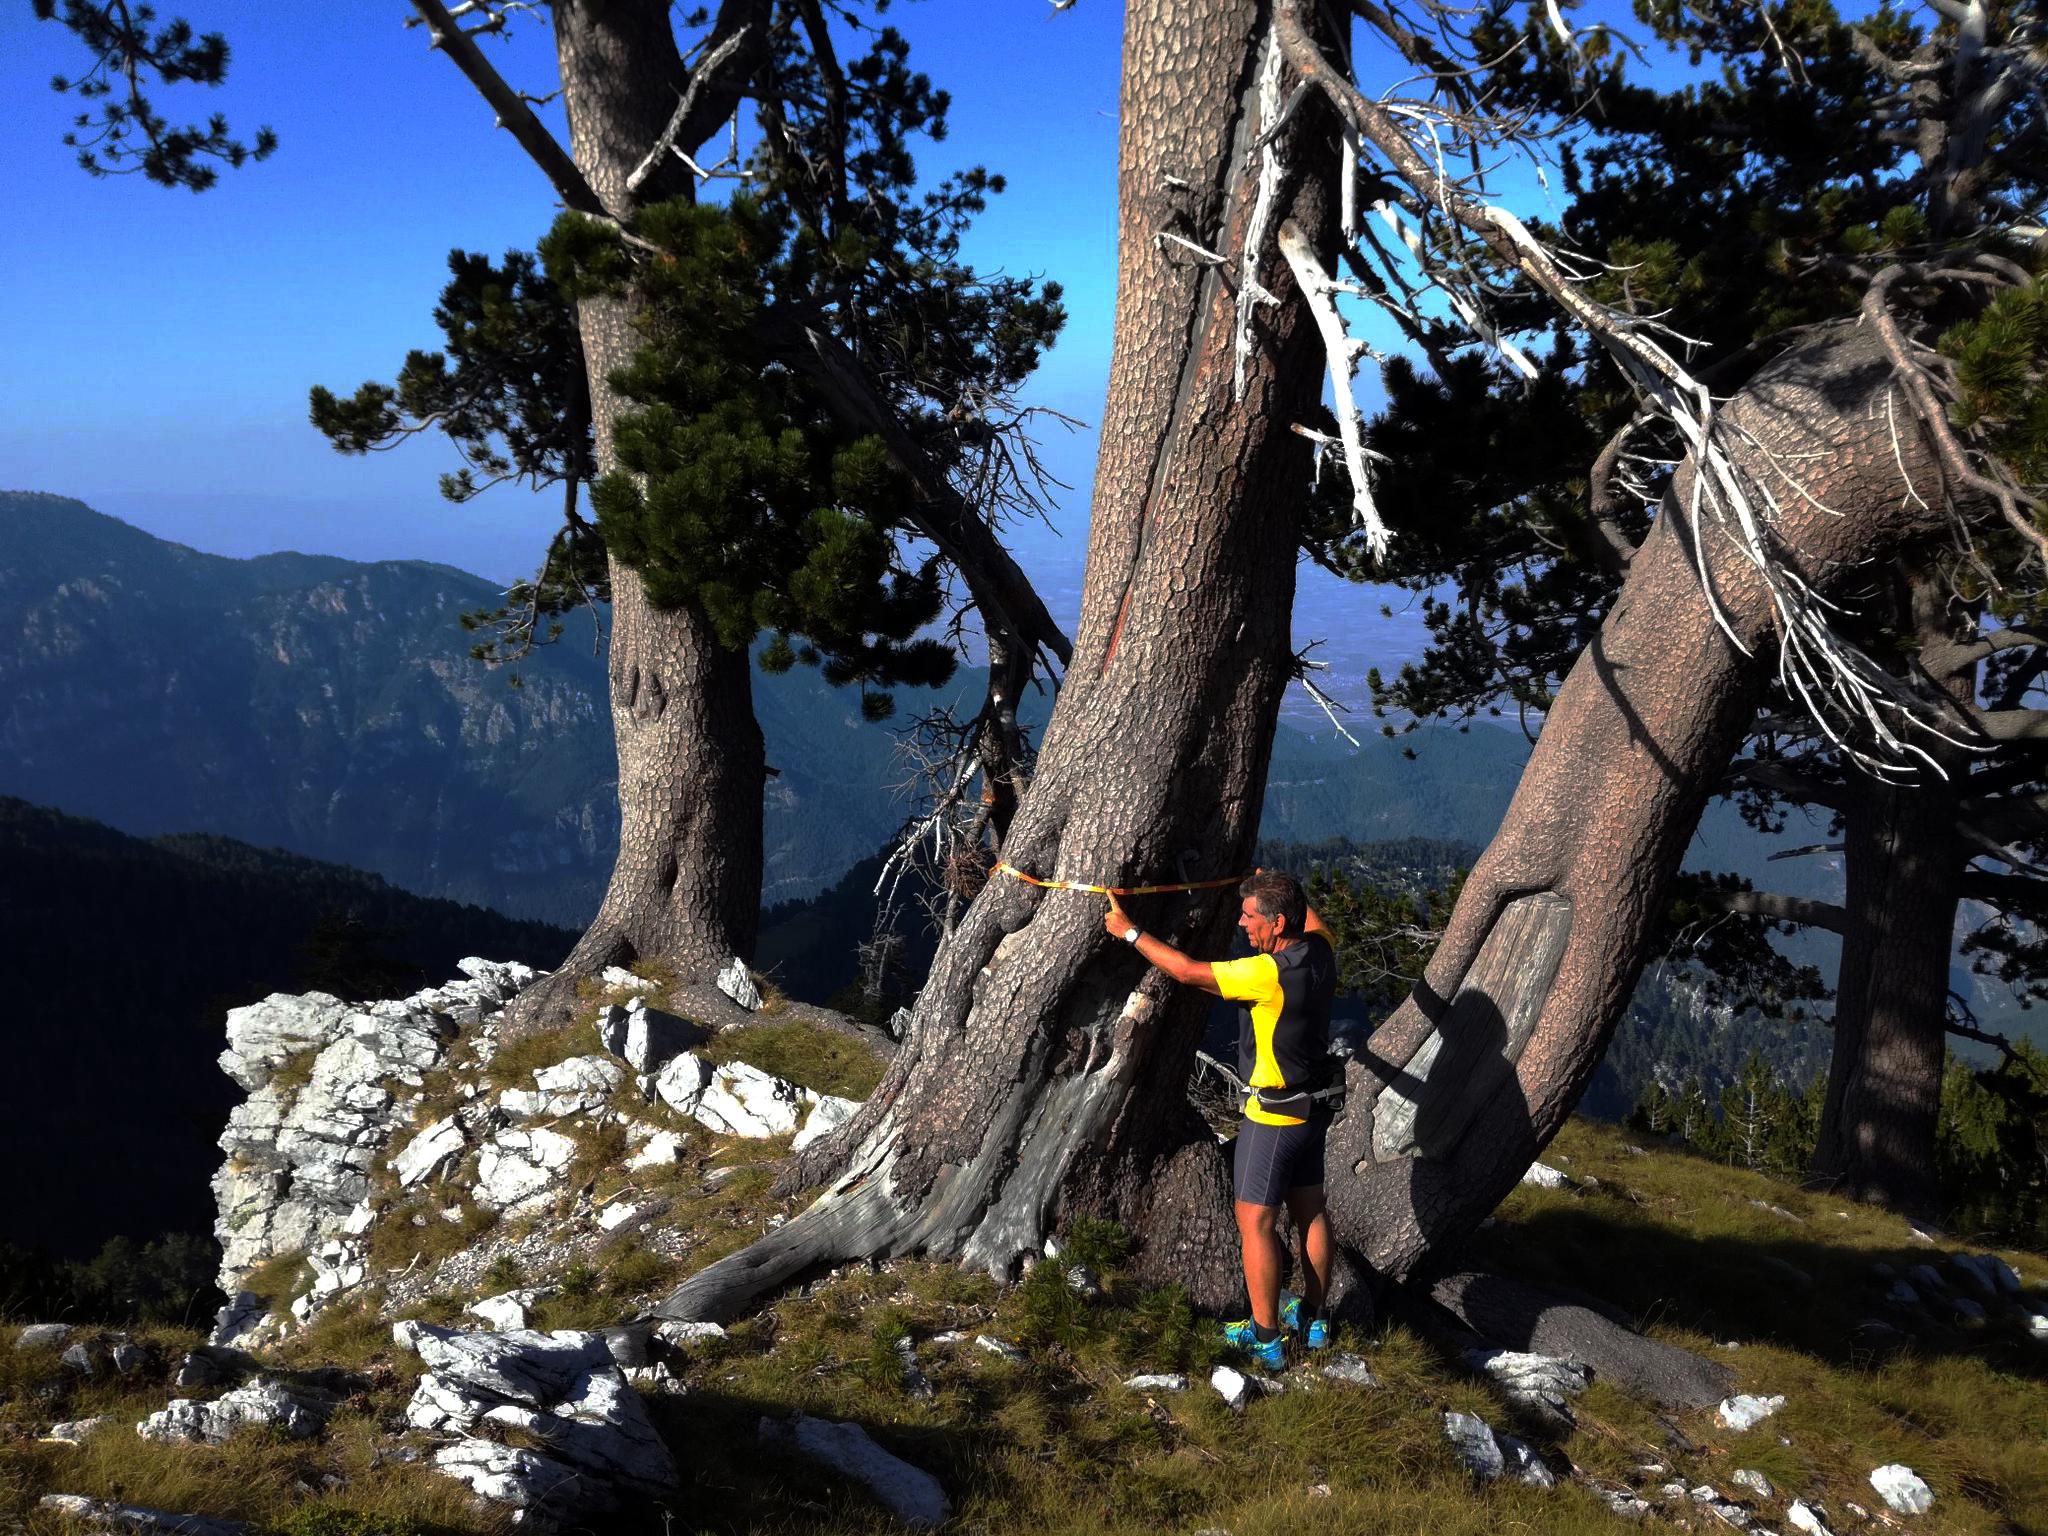
[Measuring circumference of a Pinus heldreichii in alpine zone on mt.Olympus, Livadaki, 2062m. alt. – Research Area: LIT-216669S5]
Green-Up/Green-Down:
Phenology is the study of the timing of natural events in the life cycles of plants and animals, particularly in relation to seasonal and climatic changes. It involves observing and recording events such as flowering, leafing, migration, and breeding, which are influenced by environmental factors like temperature, daylight, and precipitation. Phenological data helps scientists track patterns and shifts in ecosystems, providing valuable insights into how climate change is affecting the natural world. By understanding these changes, researchers can better predict the impacts on biodiversity, agriculture, and overall ecosystem health.
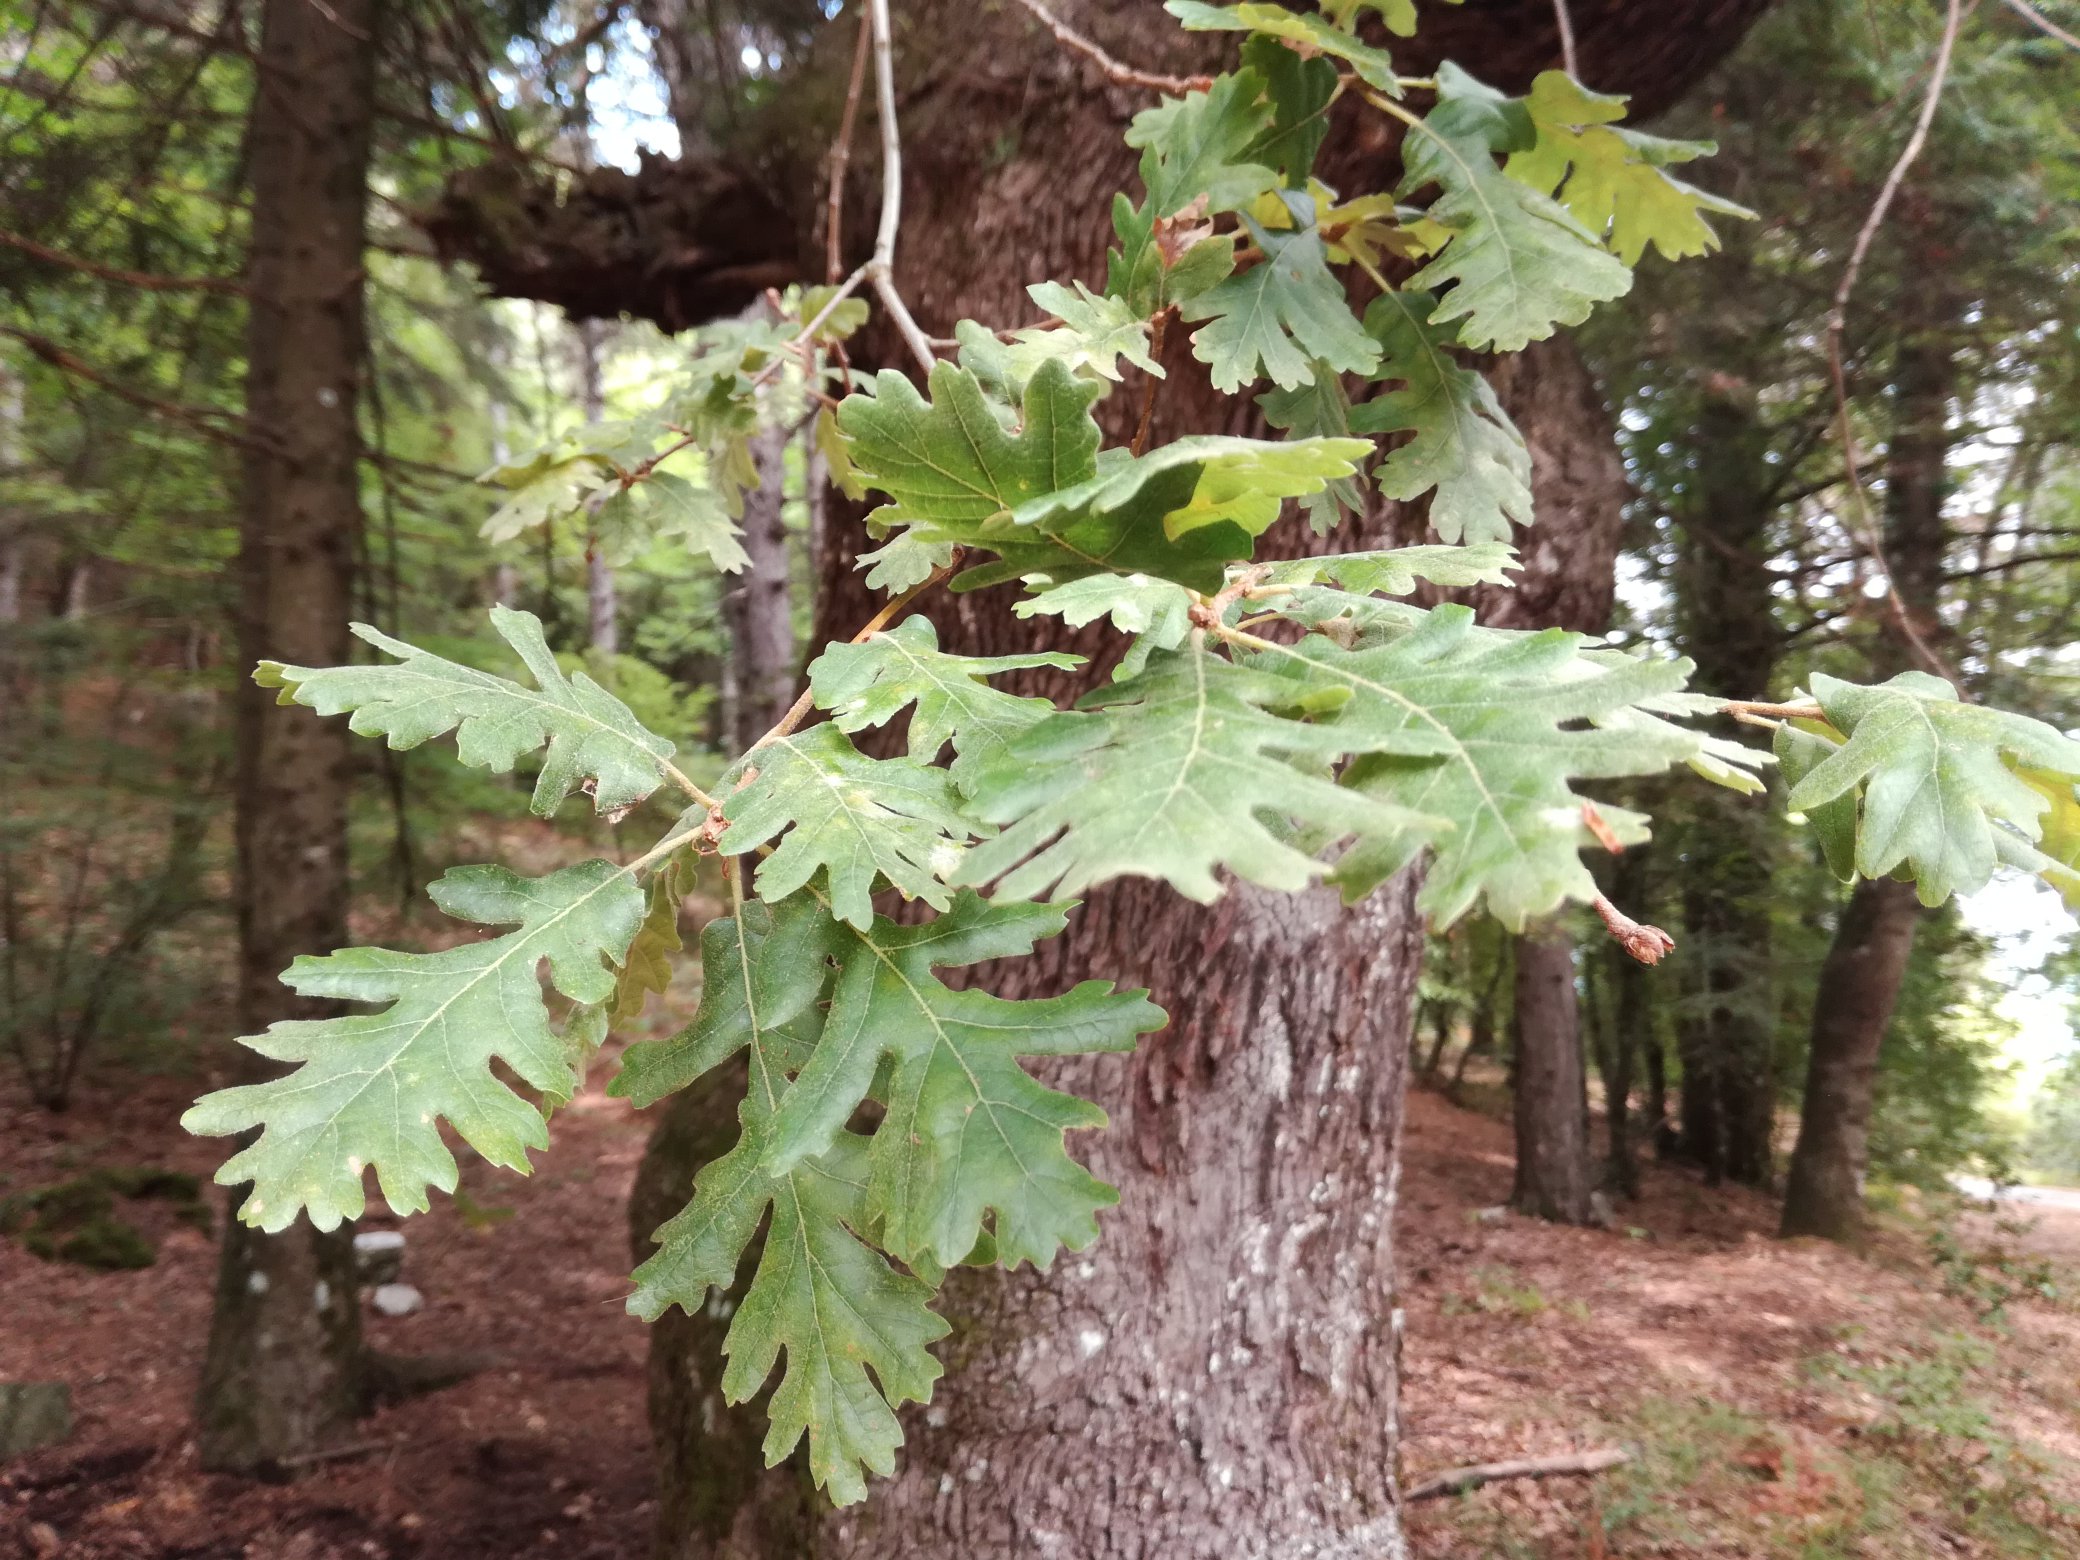
[Taking green-down measurements of Pedunculate oak [Quercus robur], mt.Olympus, Aghios Ioannis, 580m. alt. – Research Area: LIT-218186S6]
Green-Up and Green-Down measurements track the seasonal changes in vegetation, specifically the timing of leaf growth and leaf fall or color change. These observations help scientists understand plant responses to environmental factors like temperature and daylight, offering insights into the timing of growing seasons and climate change.
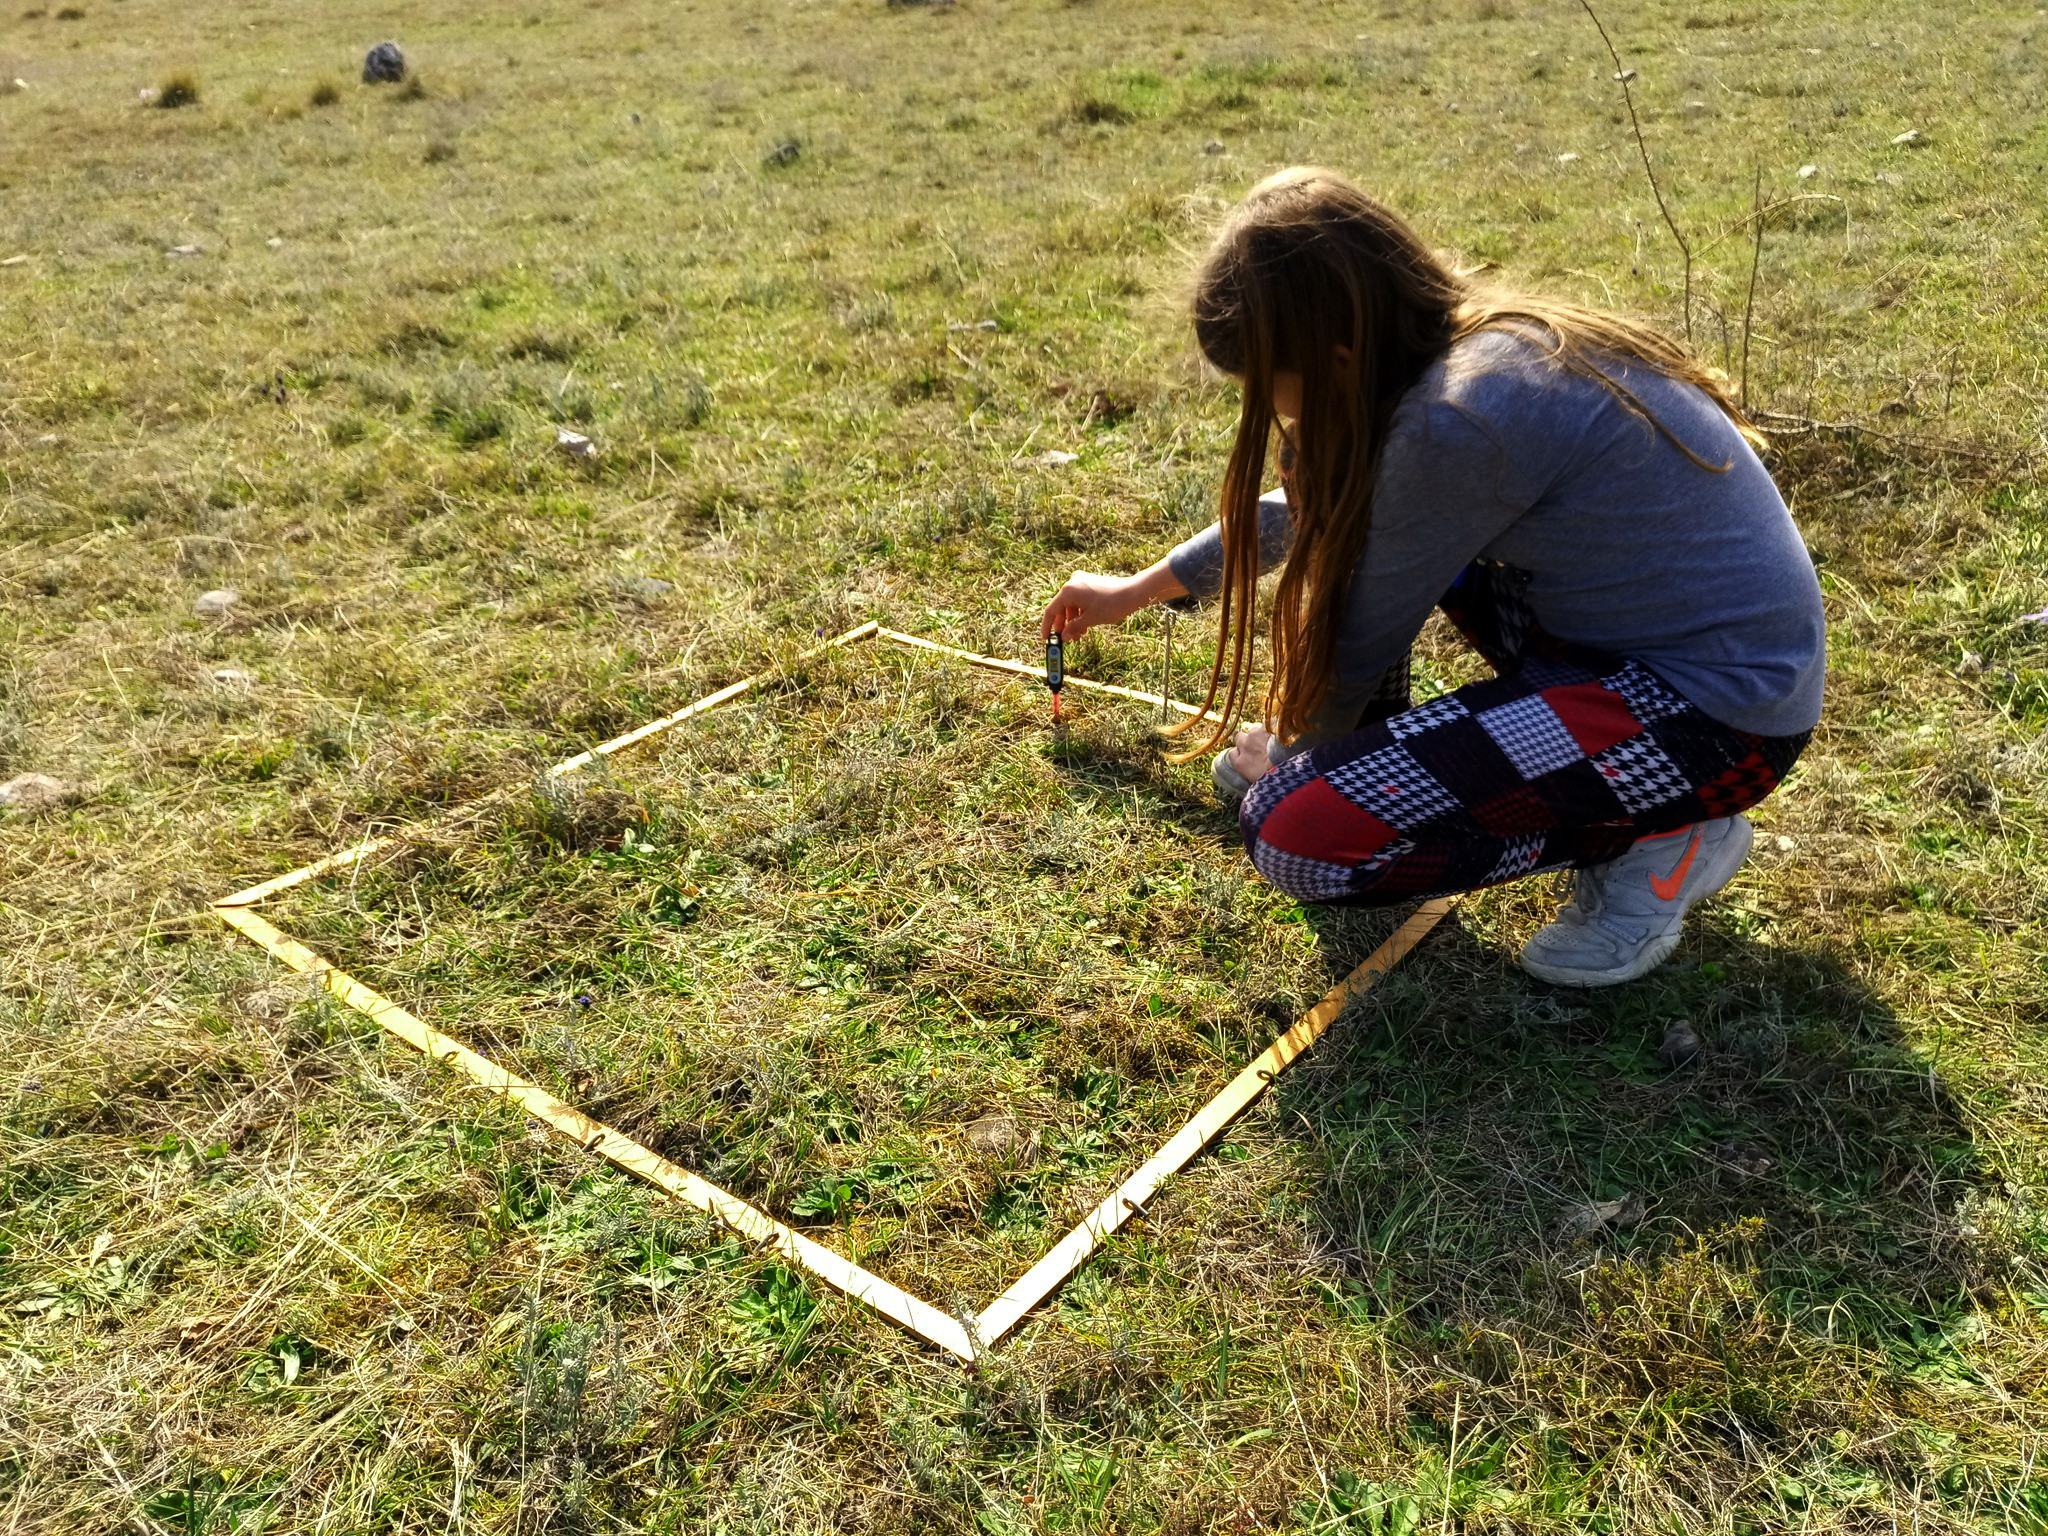
[Taking grass green-up and soil temperature observations – Research Area: LIT-193420S1]
UHIE:
The Urban Heat Island Effect [UHIE] refers to the phenomenon where urban areas experience significantly higher temperatures than their rural surroundings. This effect is primarily caused by human activities and the prevalence of heat-absorbing materials like asphalt, concrete, and buildings, which retain heat during the day and release it slowly at night. The lack of vegetation in cities also reduces cooling through evaporation and transpiration, further intensifying the heat.
Taking Surface Temperature measurements is crucial for understanding and mitigating the UHIE. These measurements help identify hotspots within urban areas, assess the effectiveness of cooling strategies like green roofs and urban forests, and monitor changes over time. Accurate surface temperature data also contributes to better climate modeling and urban planning, helping cities design more sustainable environments that reduce the impacts of UHIE on energy consumption, air quality, and public health. By tracking surface temperatures, researchers can develop strategies to cool urban areas, improve the quality of life for residents, and mitigate the broader effects of climate change.
[Taking surface temperature measurements for the ‘UHIE – Surface Temperature Field Campaign’ – Research Area: LIT-193420S1]
Mosquito habitats:
Mosquitoes can transmit a wide range of diseases, with over a dozen significant ones affecting humans. Some of the most notable mosquito-borne diseases include Malaria, Dengue fever, Zika virus, West Nile virus, Chikungunya, Yellow fever, Japanese encephalitis, Rift Valley fever, Filariasis [including lymphatic filariasis].
Tracking and recording mosquito habitats is crucial for preventing the spread of these diseases. Mosquitoes breed in standing water, so identifying and monitoring these habitats can help control their population before they reach adulthood and become vectors for disease.
Identifying mosquito larvae is particularly important for determining the presence of dangerous species, such as Aedes aegypti [which transmits dengue, Zika, and chikungunya] or Anopheles mosquitoes [which transmit malaria]. By tracking these larvae, communities can take proactive measures to eliminate breeding sites and reduce the risk of disease transmission. This local surveillance is vital for public health, as it helps target interventions like insecticide application, habitat removal, and public education, ultimately reducing the incidence of mosquito-borne diseases.
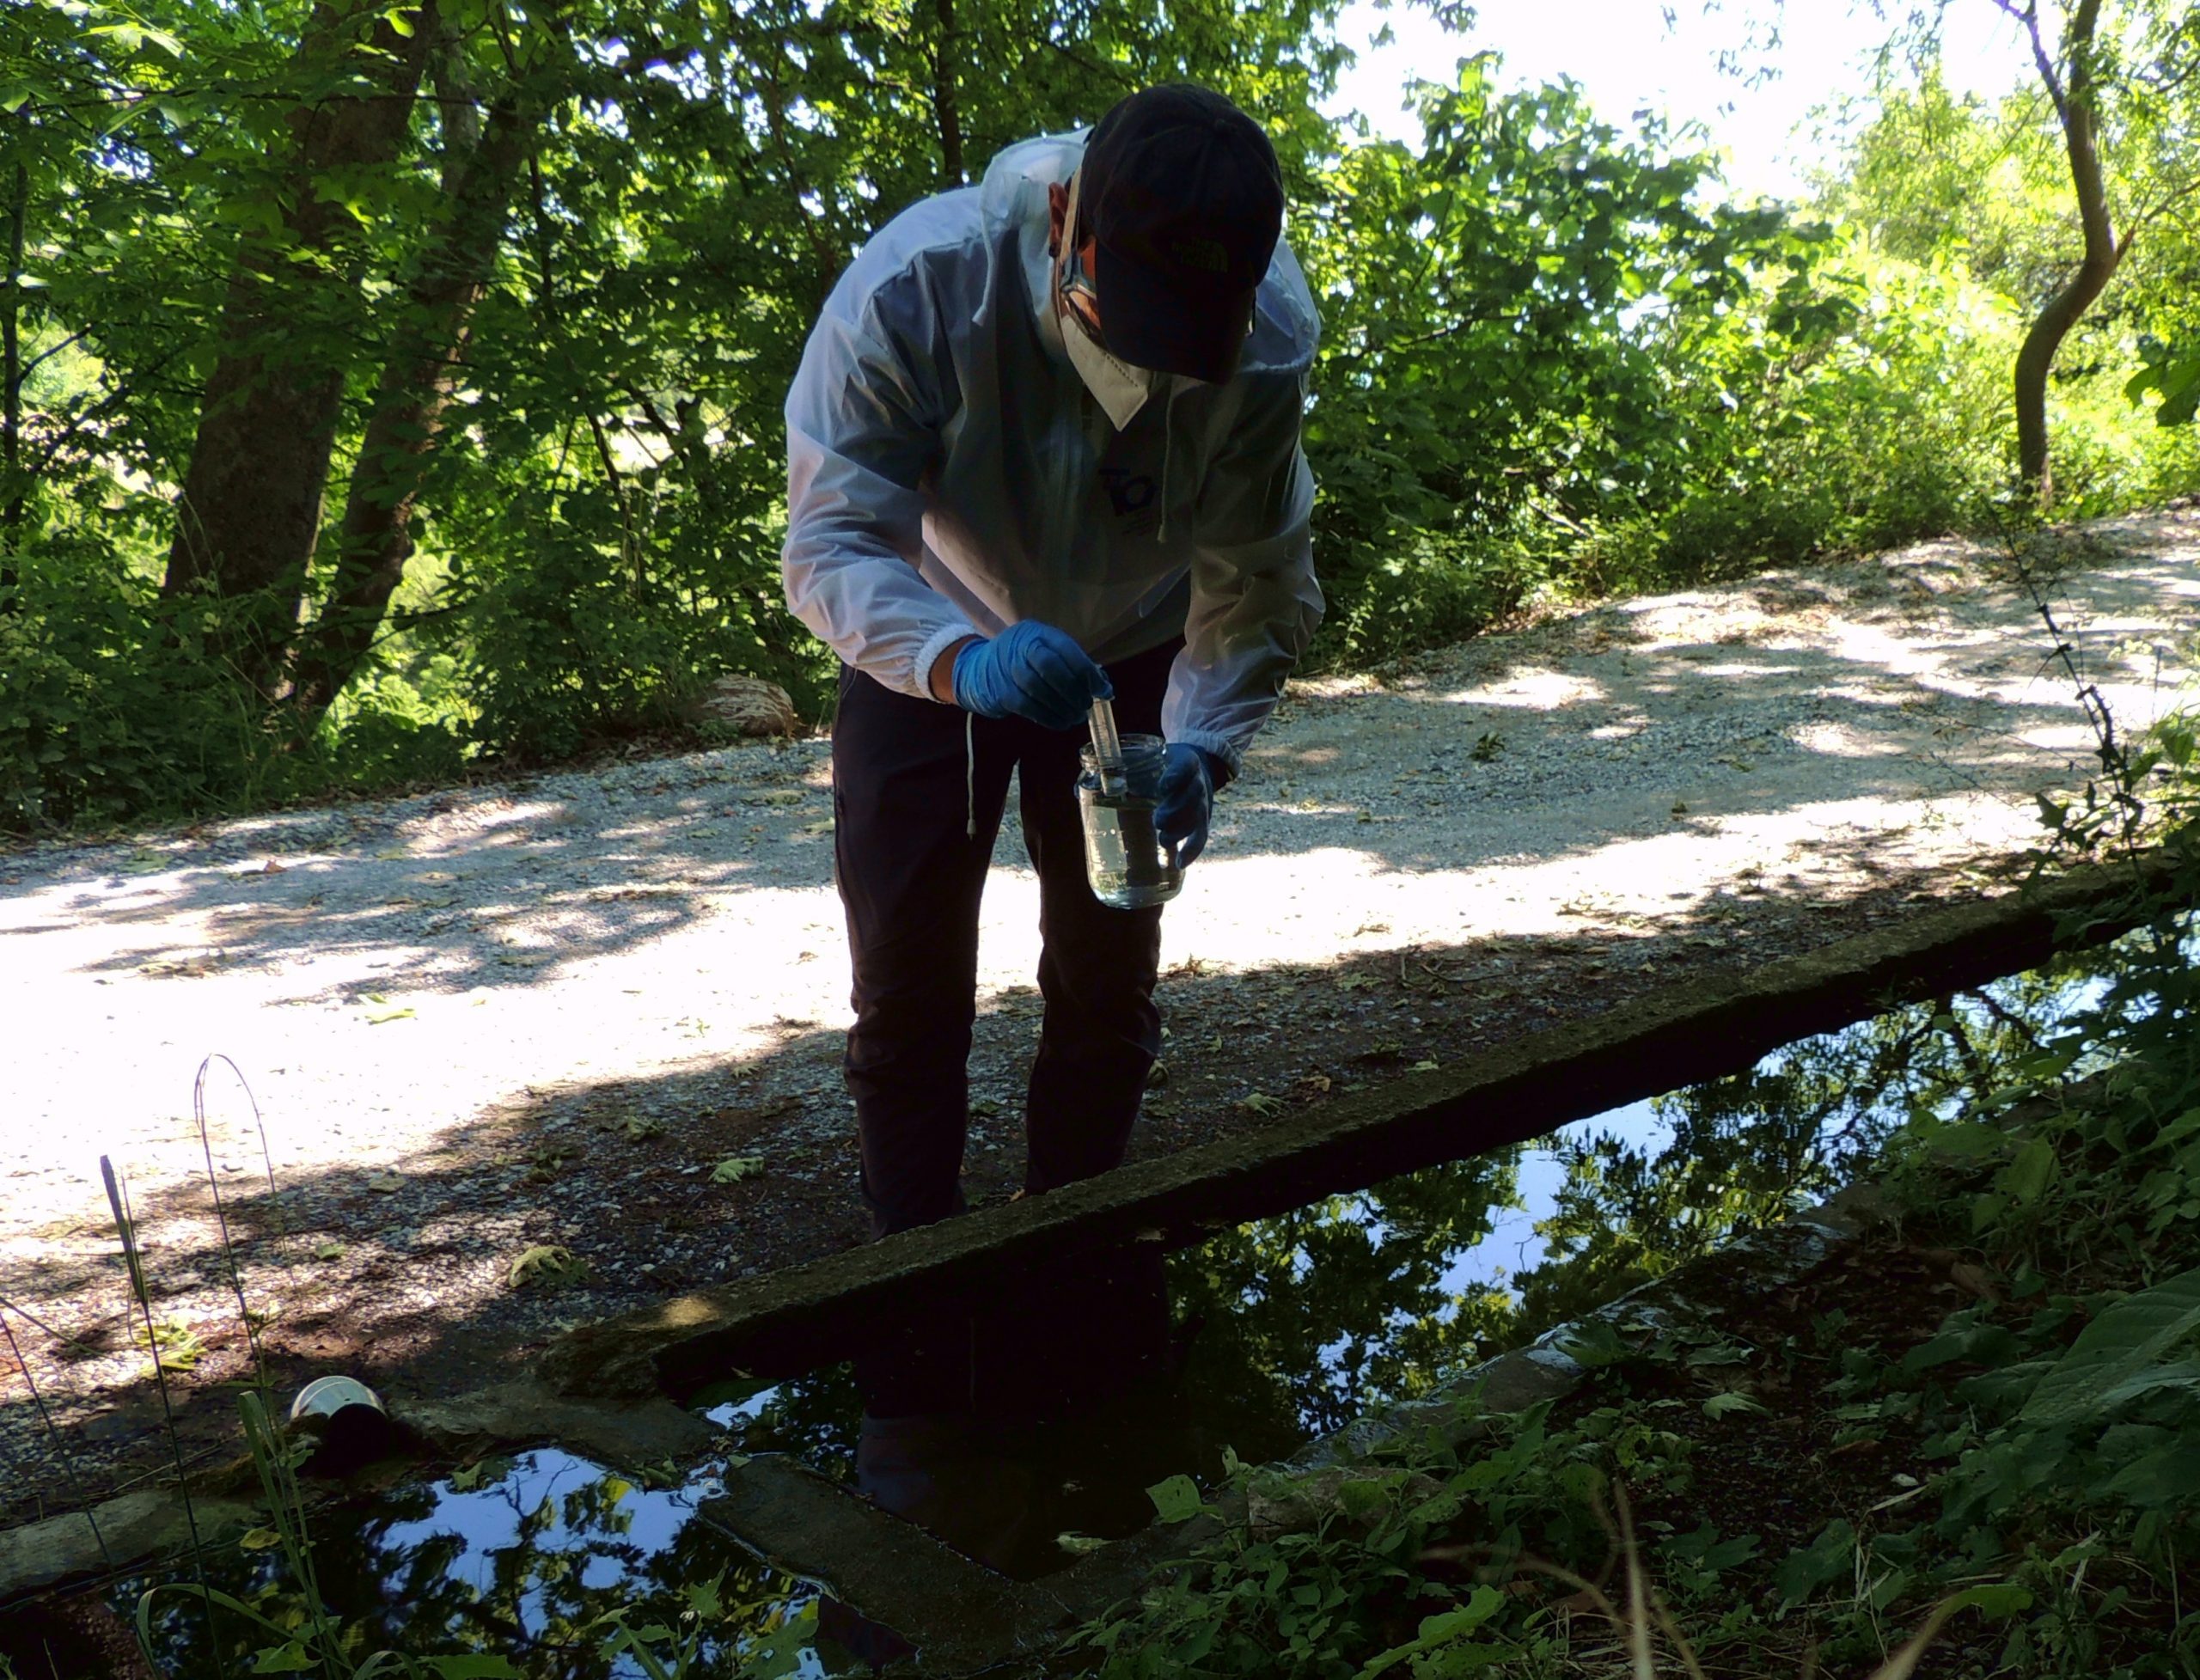
[Field sampling method for mosquito larvae identification]
Campaigns/Participations:
[01]: 22.03.2020 Completion of ‘GLOBE Training‘ [Cert]
[02]: 22.03.2020 Educator Certification of the ‘GLOBE Program‘ [Cert]
[03]: 15.07.2020-15.08.2020 Participation of tinycore lab Team in ‘2020 Community Cloud Challenge‘ [Cert]
[04]: 09.20-09.2021 Participation of tinycore lab Team in ‘Trees Around the GLOBE Student Research Campaign‘
[05]: 10.09.2020-03.12.2020 Participation of tinycore lab Team in ‘European Phenology Campaign – Autumn 2020‘ [Cert]
[06]: 03.2021 Participation of tinycore lab Team in ‘Urban Heat Island Effect [UHIE] – Surface Temperature Field Campaign – March 2021‘
[07]: 03-06.2021 Participation of tinycore lab Team in ‘European Phenology Campaign – Spring 2021‘ [Cert]
[08]: 29.03.2021-05.04.2021 Participation of tinycore lab Team to judge projects for the ‘2021 International Virtual Science Symposium [IVSS]‘ [Cert]
[09]: 15.04.2021-15.05.2021 Participation of tinycore lab Team in ‘2021 Community Trees Challenge‘ [Cert]
[10]: 25.07.2021-25.08.2021 Participation of tinycore lab Team in ‘Mosquito Habitat Photo Challenge 2021‘ [Cert]
[11]: 10.09.2021-03.12.2021 Participation of tinycore lab Team in ‘European Phenology Campaign – Autumn 2021‘ [Cert]
[12]: 10.2021-09.2022 Participation of tinycore lab Team in ‘Trees Around the GLOBE Student Research Campaign‘
[13]: 10/12.2021/03.2022 Participation of tinycore lab Team in ‘Urban Heat Island Effect [UHIE] – Surface Temperature Field Campaign‘
[14]: 03-06.2022 Participation of tinycore lab Team in ‘European Phenology Campaign – Spring 2022‘ [Cert]
[15]: 25.03.2022 Participation of tinycore lab Team in ‘Air Temperature Data Challenge‘
[16]: 12.10.2022-10.01.2023 Participation of tinycore lab Team in ‘European Phenology Campaign – Autumn 2022‘
[17]: 12.2022/03.2023 Participation of tinycore lab Team in ‘Urban Heat Island Effect [UHIE] – Surface Temperature Intensive Observation Period [IOP]‘
[18]: 09-12.2023 Participation of tinycore lab Team in ‘European Phenology Campaign – Spring 2023‘ [Cert]
[19]: 09-12.2023 Participation of tinycore lab Team in ‘European Phenology Campaign – Autumn 2023‘ [Cert]
[20]: 08.2023-08.2024 Participation of tinycore lab Team in ‘Year of Climate and Carbon Campaign‘
[21]: 10.2024-03.2025 Participation of tinycore lab Team in ‘Urban Heat Island Effect [UHIE] – Surface Temperature Intensive Observation Period [IOP]‘
[22]: 10.2024-01.2025 Participation of tinycore lab Team in ‘European Phenology Campaign – Autumn 2024‘ [Cert]
[23]: 02.2025 Participation of tinycore lab Team in ‘Snow View Intensive Observation Period‘
[24]: 03-06.2025 Participation of tinycore lab Team in ‘European Phenology Campaign – Spring 2025‘
[25]: 10.2024-09.2025 Participation of tinycore lab Team in ‘Trees Around the GLOBE Student Research Campaign‘
